
Jobber Home Service Economic Report
2024 Q4 | February 2025


Overview
Small businesses employ 61.7 million Americans, totaling 46.4% of private sector employees1. As the leading software for home service businesses, Jobber is uniquely positioned to identify aggregate trends and insights in this important small business segment. More than 250,000 residential cleaners, landscapers, HVAC technicians, and more, keep track of jobs and charge their customers for work using Jobber.
Home service is regaining momentum after a slow 2024. Strengthening consumer spending, a recovering housing market, and accelerating digital adoption are driving renewed growth. As we enter 2025, these shifts create new business opportunities across the category.
Our analysis of the home service economy in 2024 and outlook for 2025 highlight five trends:
- Volatile consumer demand but resilient spending
- Higher disposable income fuels home service spending
- Rising home values drive remodeling and upgrades
- Construction growth presents long-term opportunities
- Digital payments surpass traditional methods
This Jobber Home Service Economic Report will help us better understand these themes and their potential impact on home service professionals.
Key takeaways:
- Disposable income growth and stable inflation created a more favorable spending environment, increasing household investment in home services.
- Consumer demand remained volatile but resilient, offset by steady revenue growth fueled through larger invoice sizes and pricing adjustments.
- Record high home values and equity growth enable homeowners to invest in remodeling and home improvement projects.
- While high mortgage rates slowed existing home sales, new home construction presented long-term opportunities for home service businesses.
- Digital payments became a dominant trend, with nearly half of all transactions conducted electronically, signaling a major shift in consumer payment preferences.
- Late-year demand recovery, stable inflation, and strong consumer confidence set the stage for continued industry growth in 2025.
Consumer Demand
2024 saw fewer jobs scheduled overall. However, many businesses kept revenue steady by raising prices and increasing the size of each invoice. While job volume dipped, demand started picking up again toward the end of the year, which could indicate customers feel more confident about spending in 2025.
Median Revenue YoY
New Work Scheduled YoY
Average Invoice Size YoY
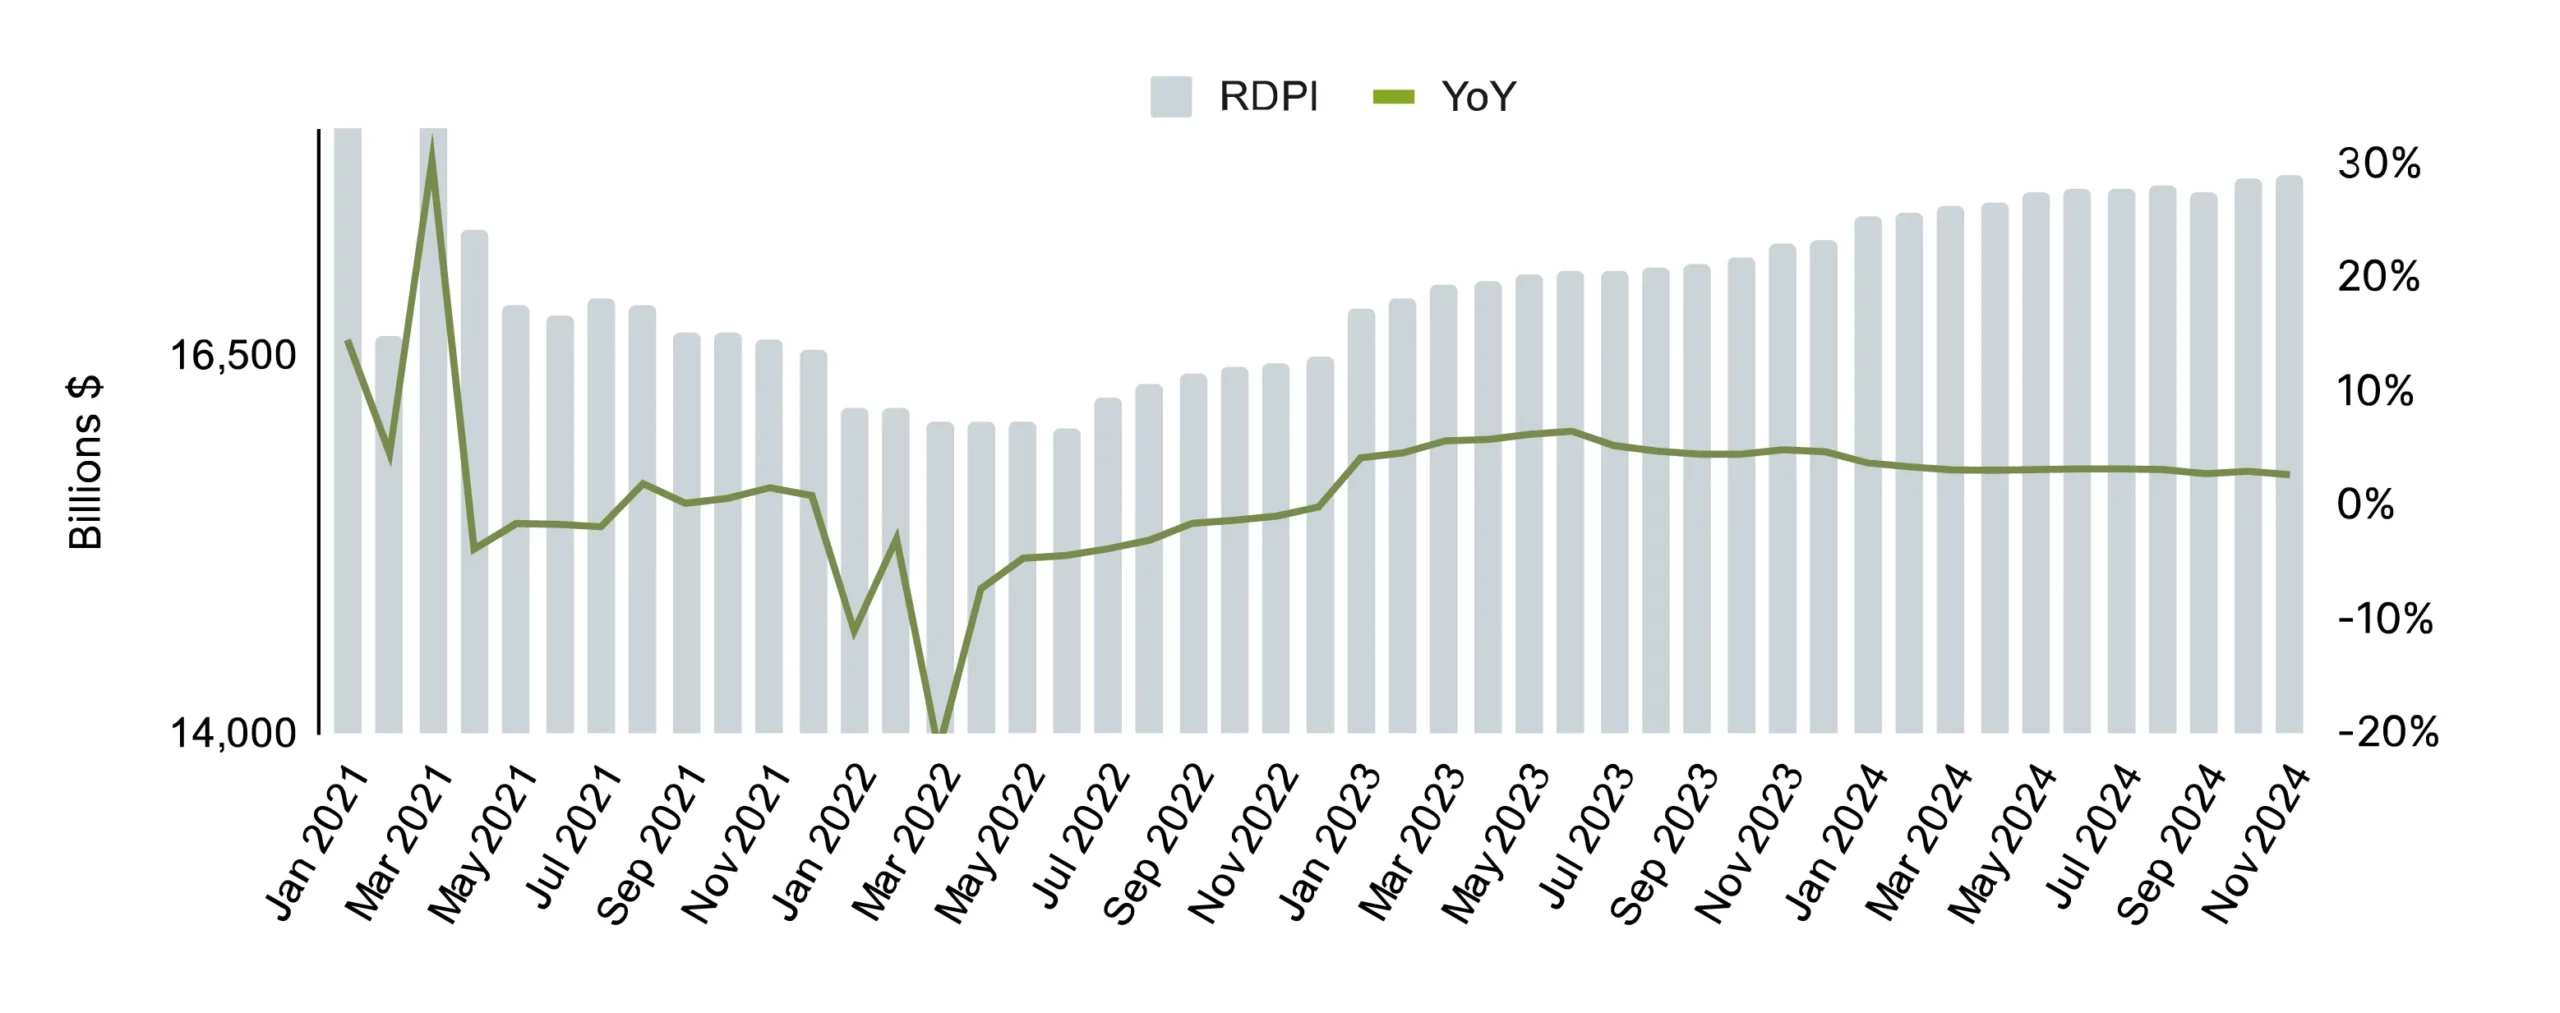
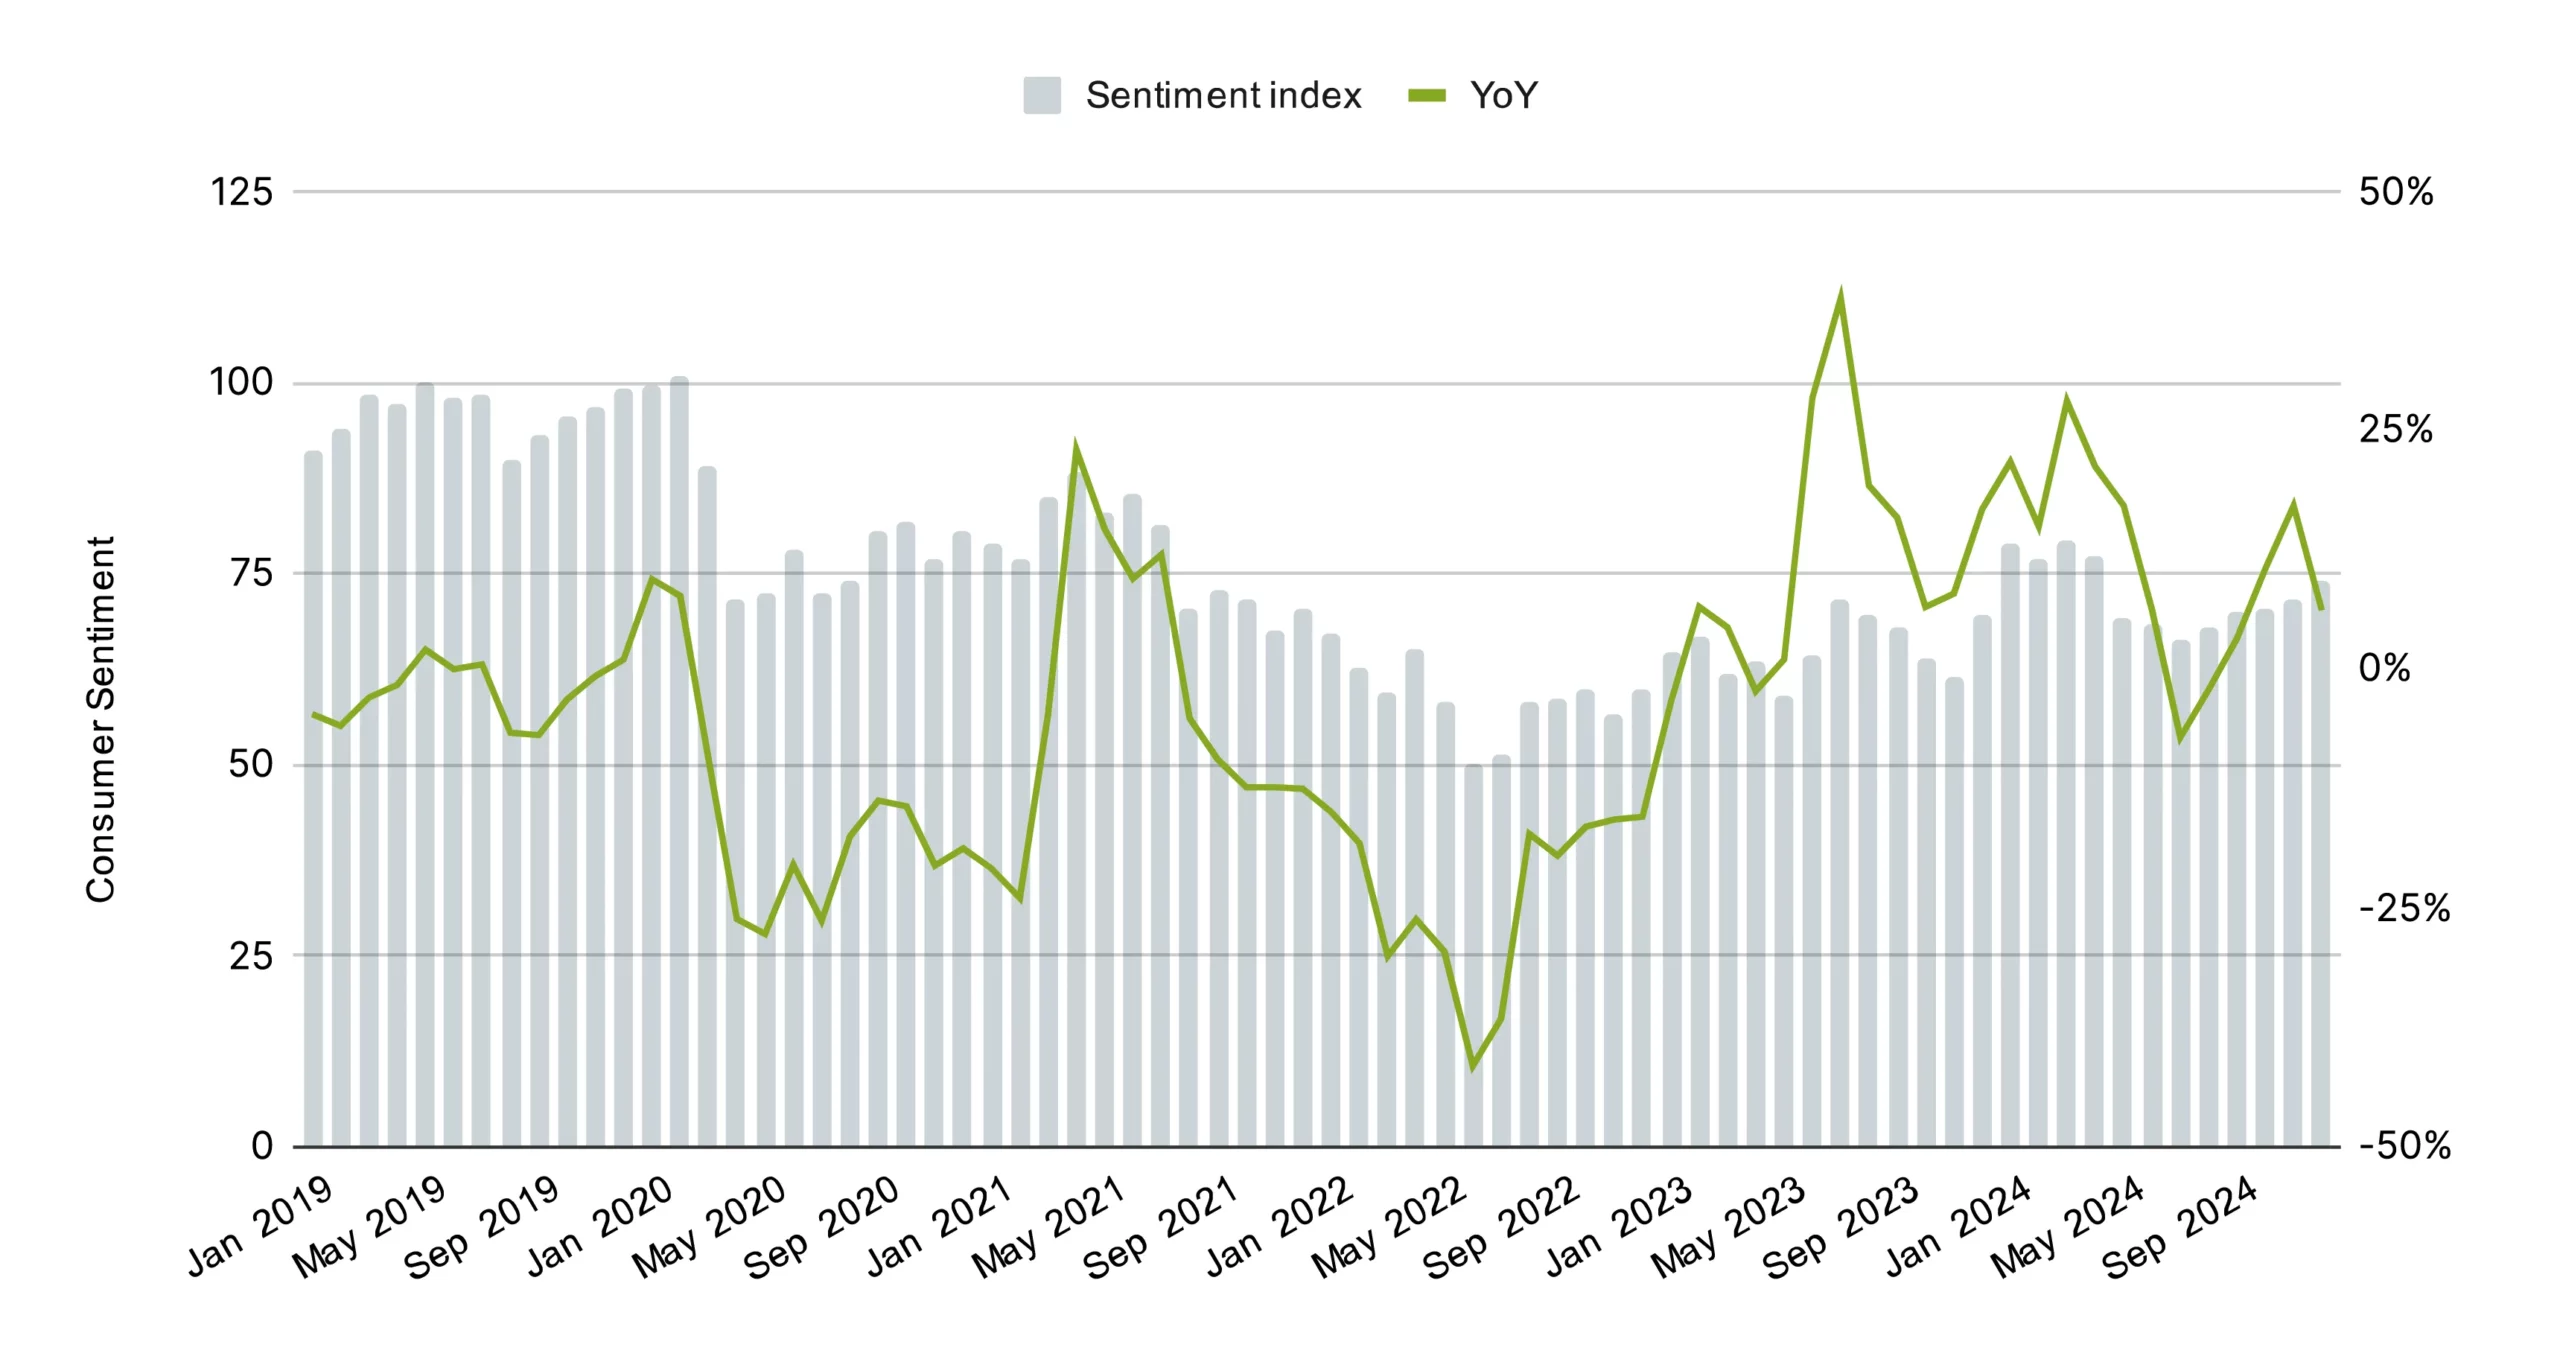
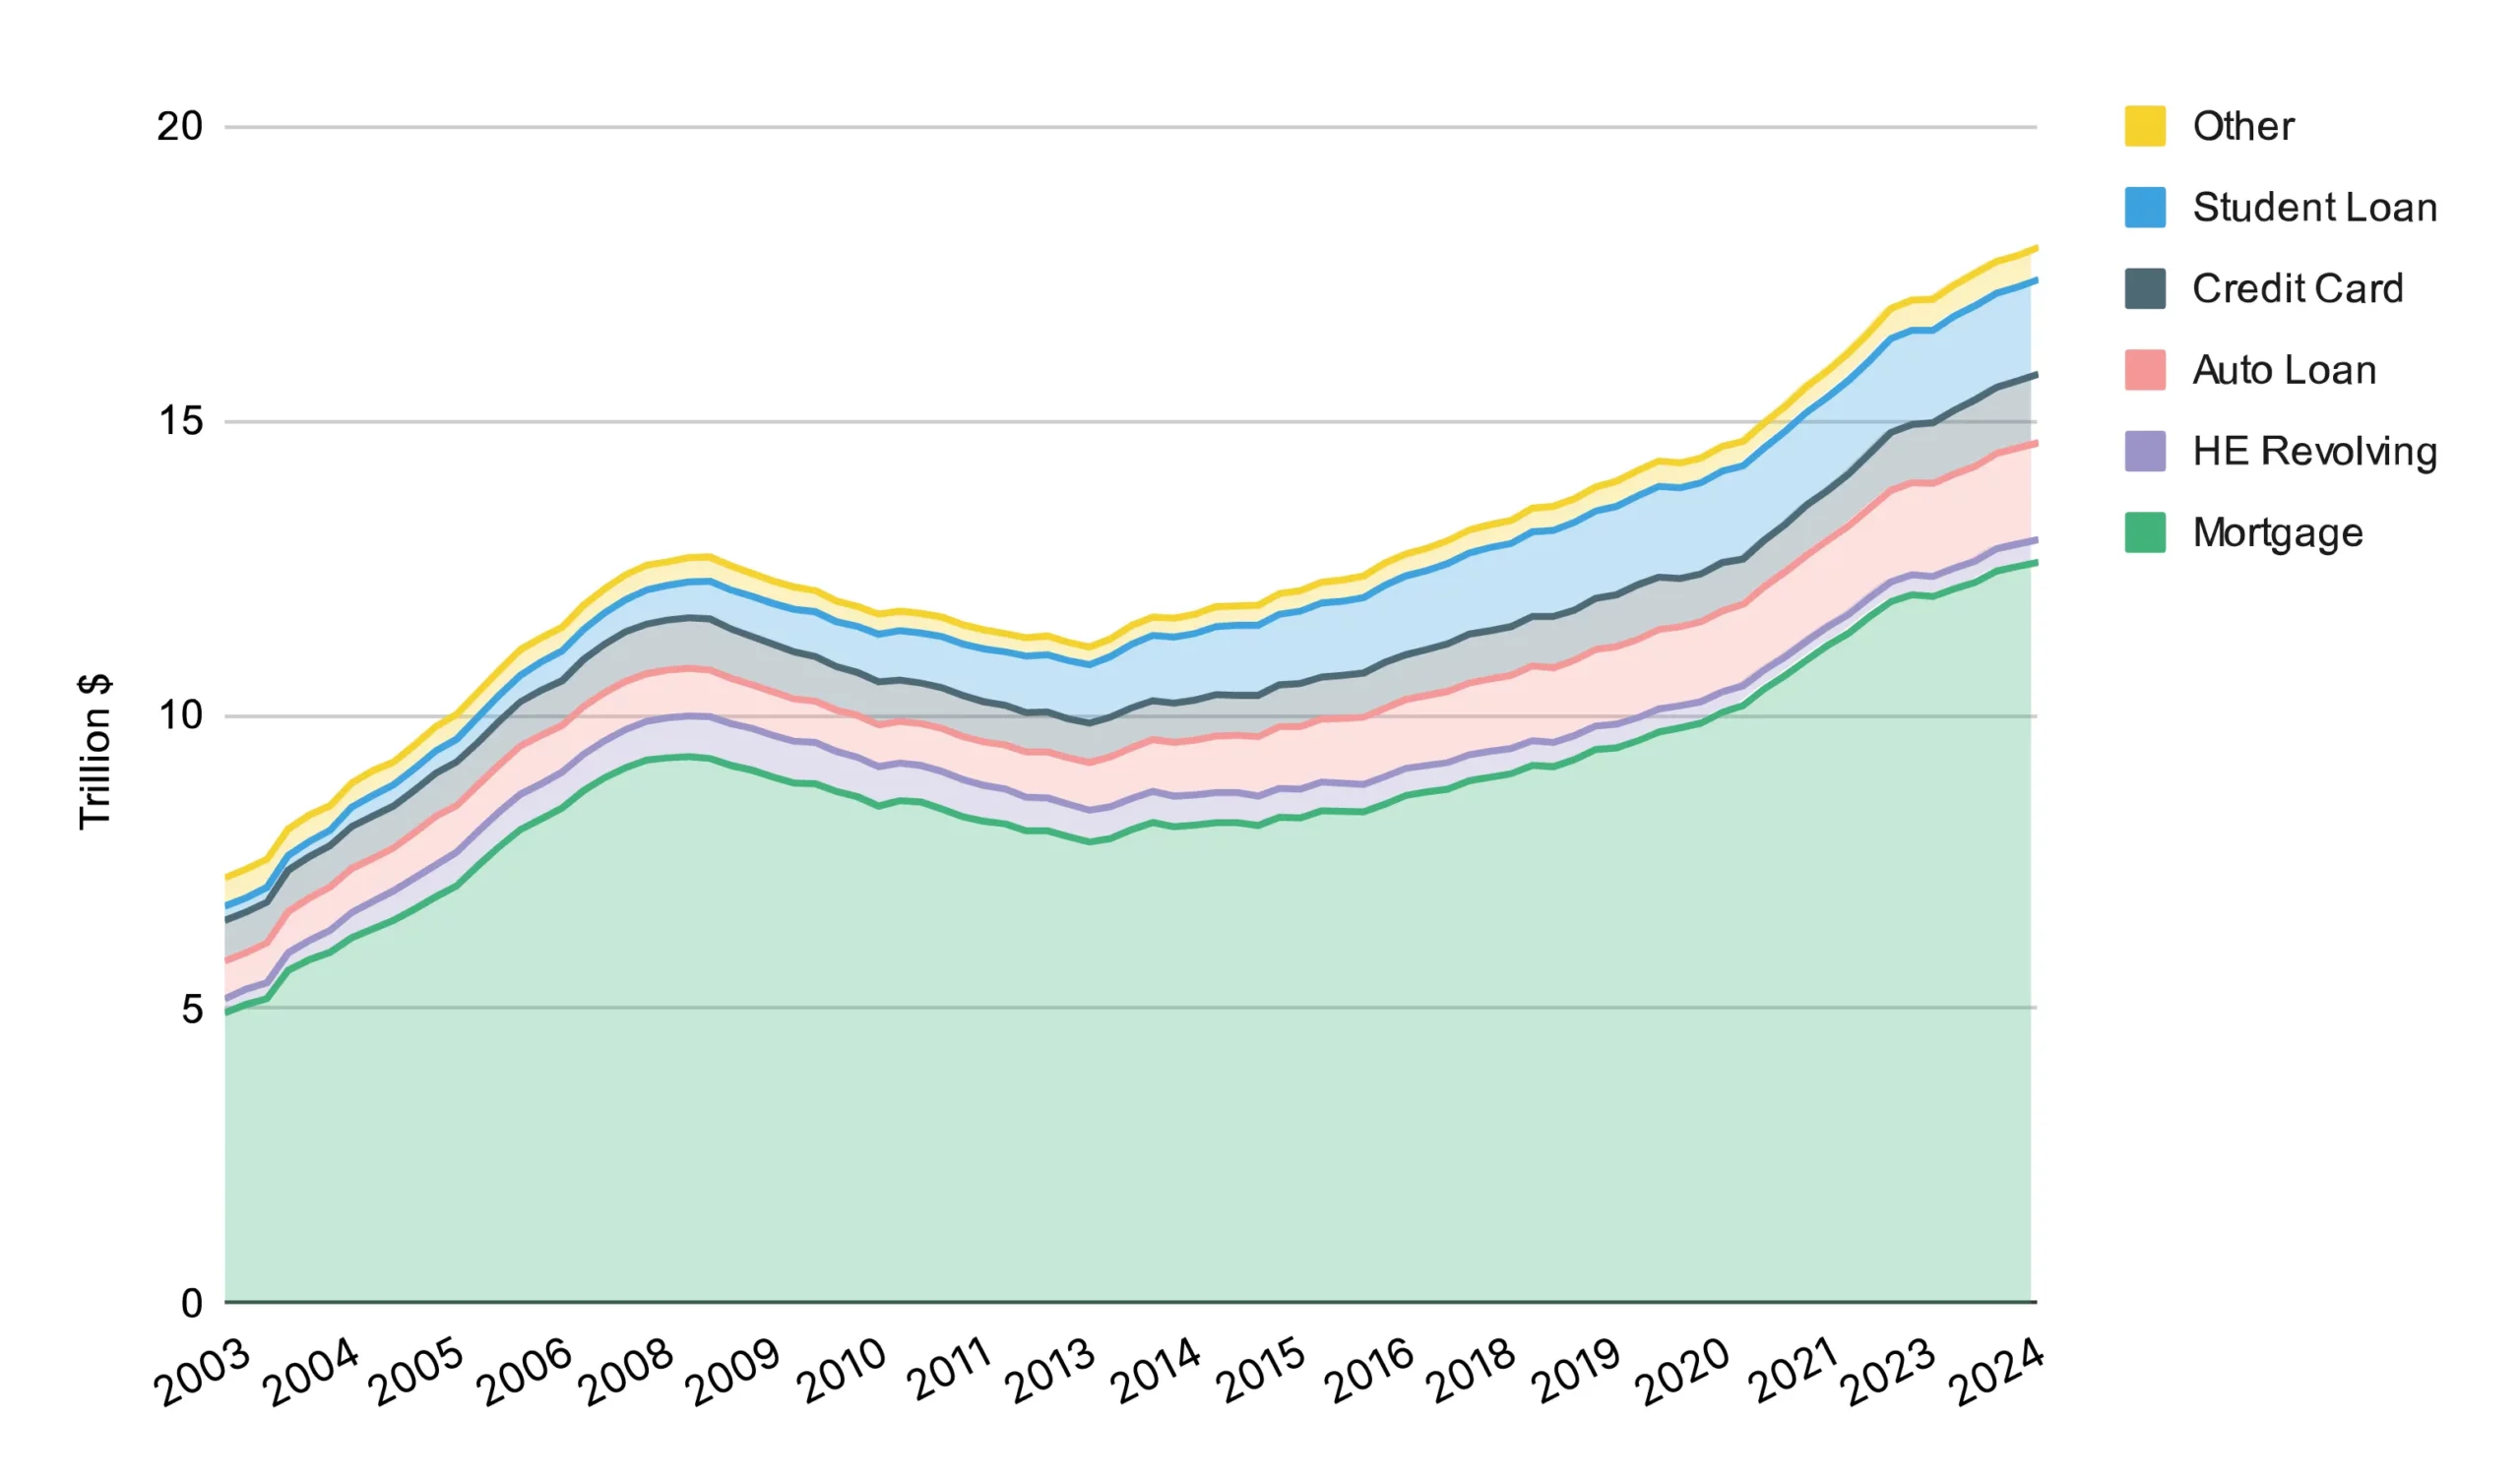
Thanks to stable prices and a strong job market, people have more money to spend and feel good about their finances. Even though debt is rising, incomes are growing even faster, giving homeowners more breathing room in their budgets. That means now is a great time for home service businesses, as more customers are willing to invest in upgrades, repairs, and maintenance.
Real Disposable Income ($Billions)2
Index of Consumer Sentiment YoY3
Total Debt Balance Category Breakdown4
“In 2024, we remained busy thanks to our loyal repeat customers, and word-of-mouth referrals. Despite the increases in material costs, we’ve worked hard to keep our services affordable for our customers while keeping the business profitable. Regardless of the challenges, which also include fewer people entering the trade, we’re grateful for steady growth and the opportunity to keep serving our community.”

Housing Market Value and Remodelling
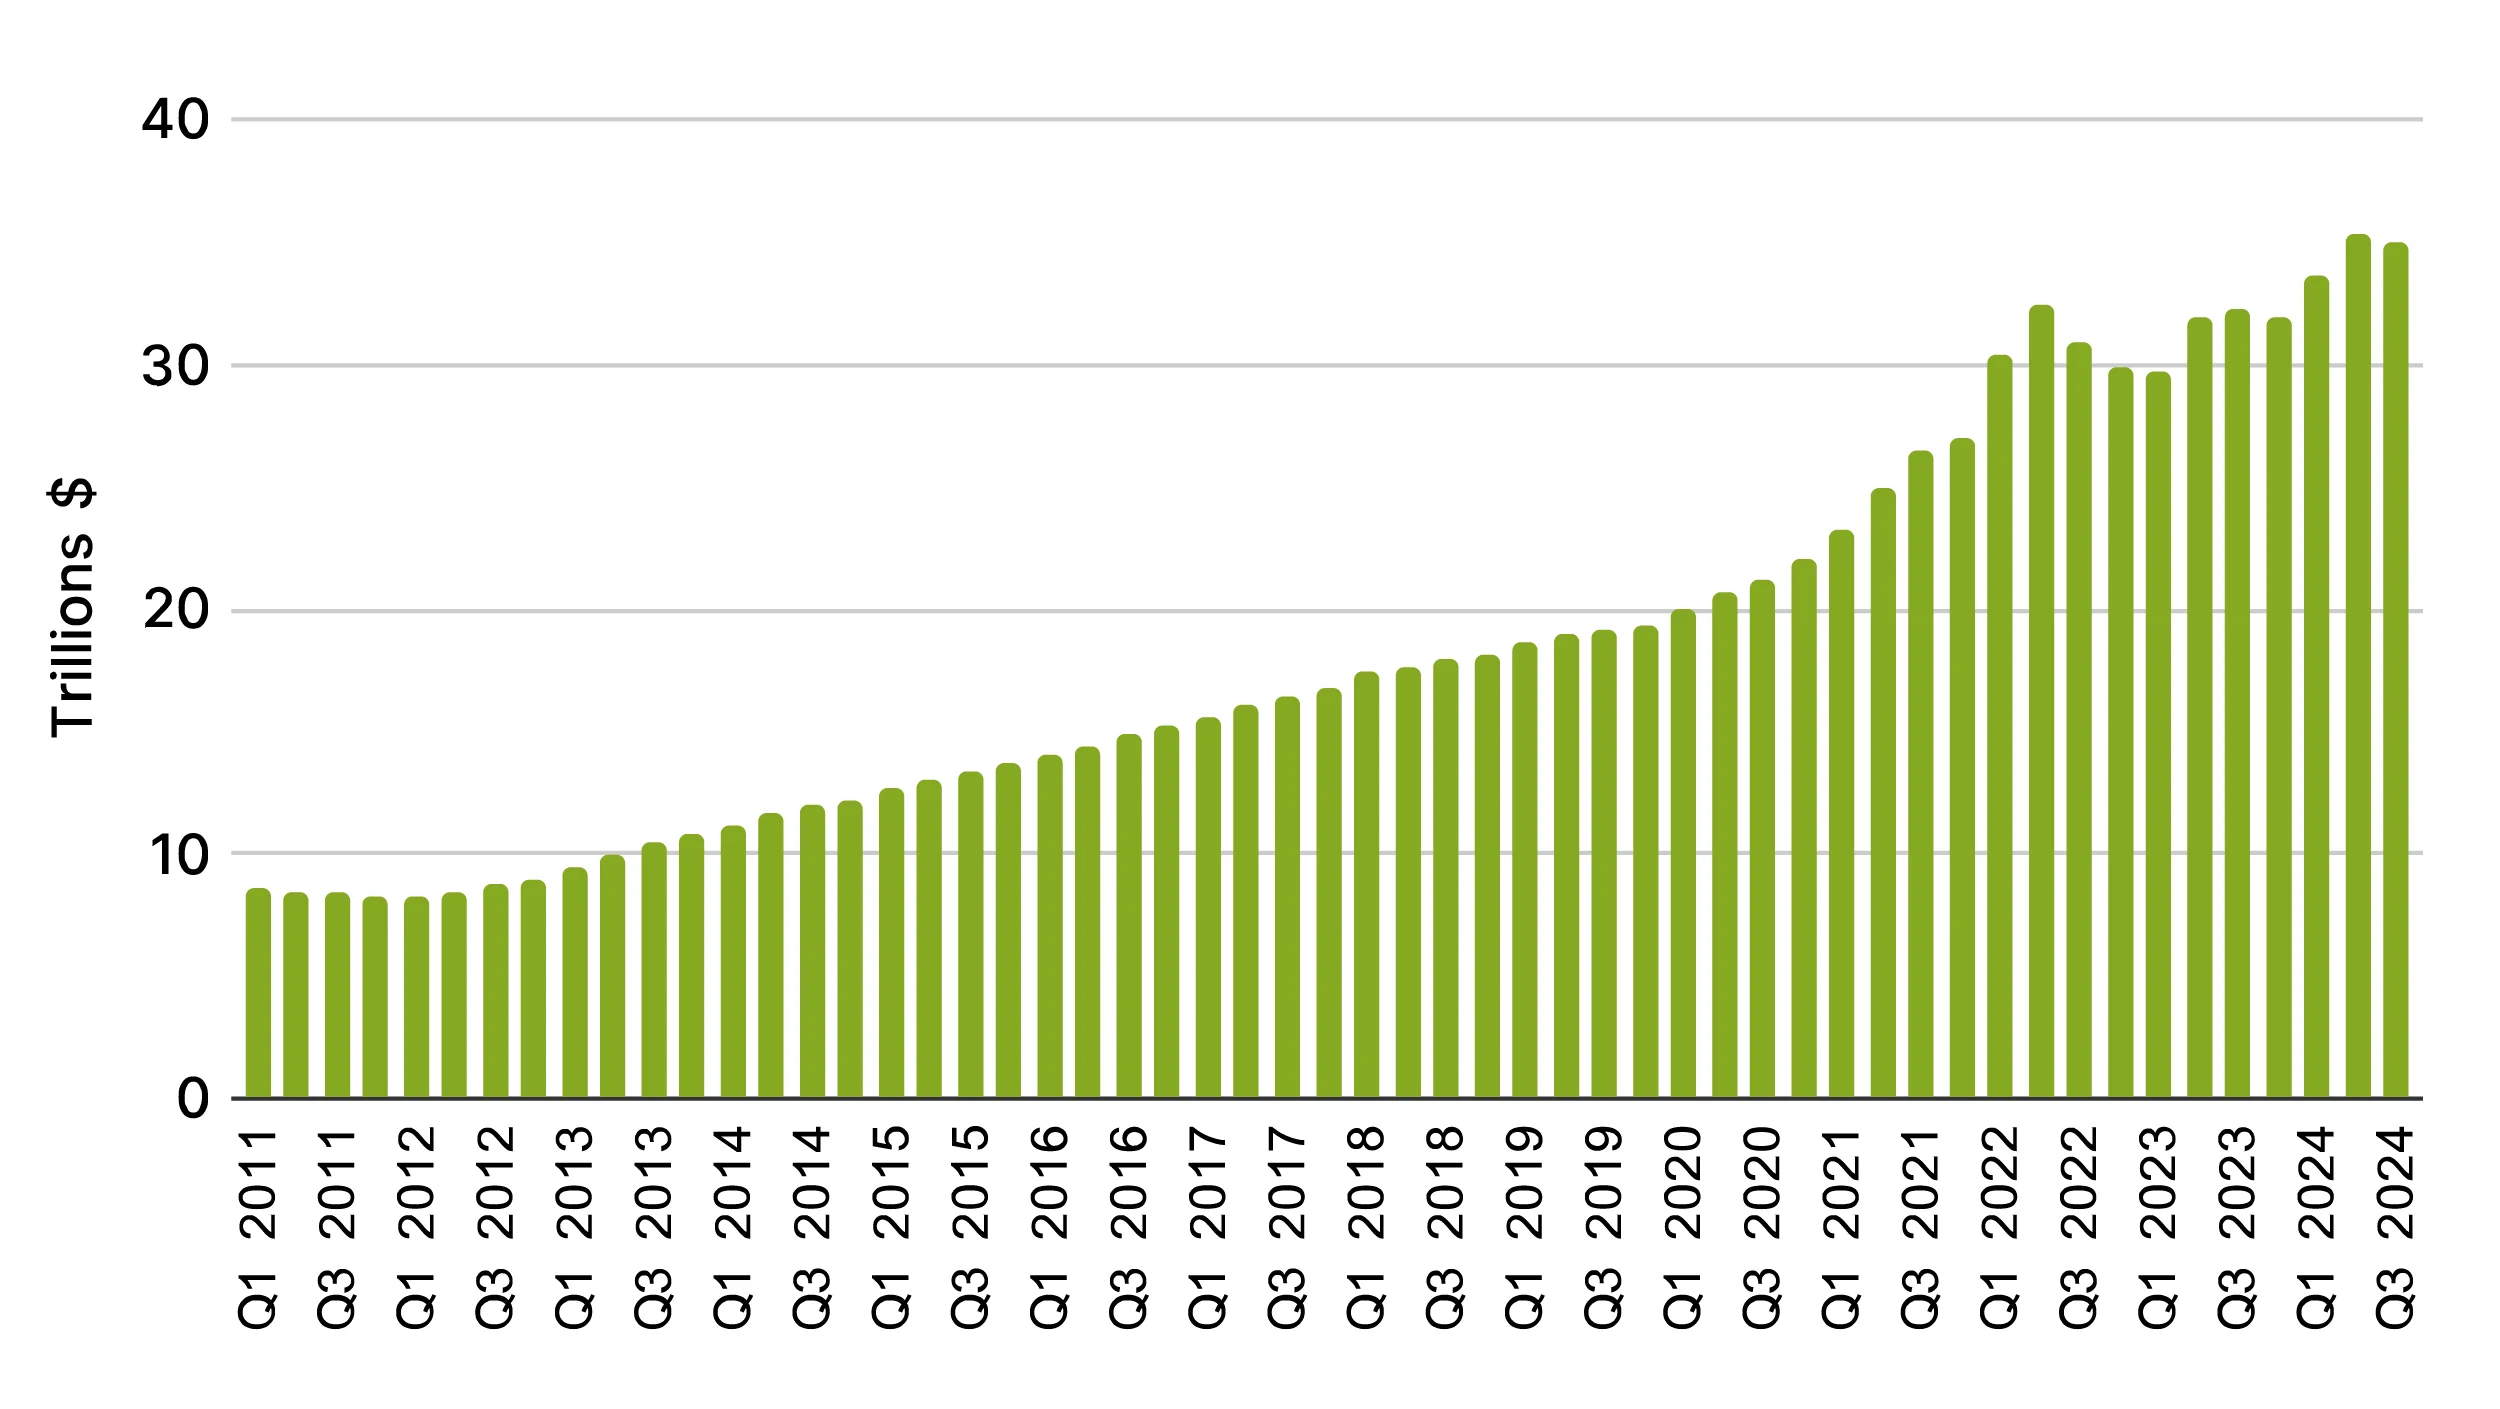
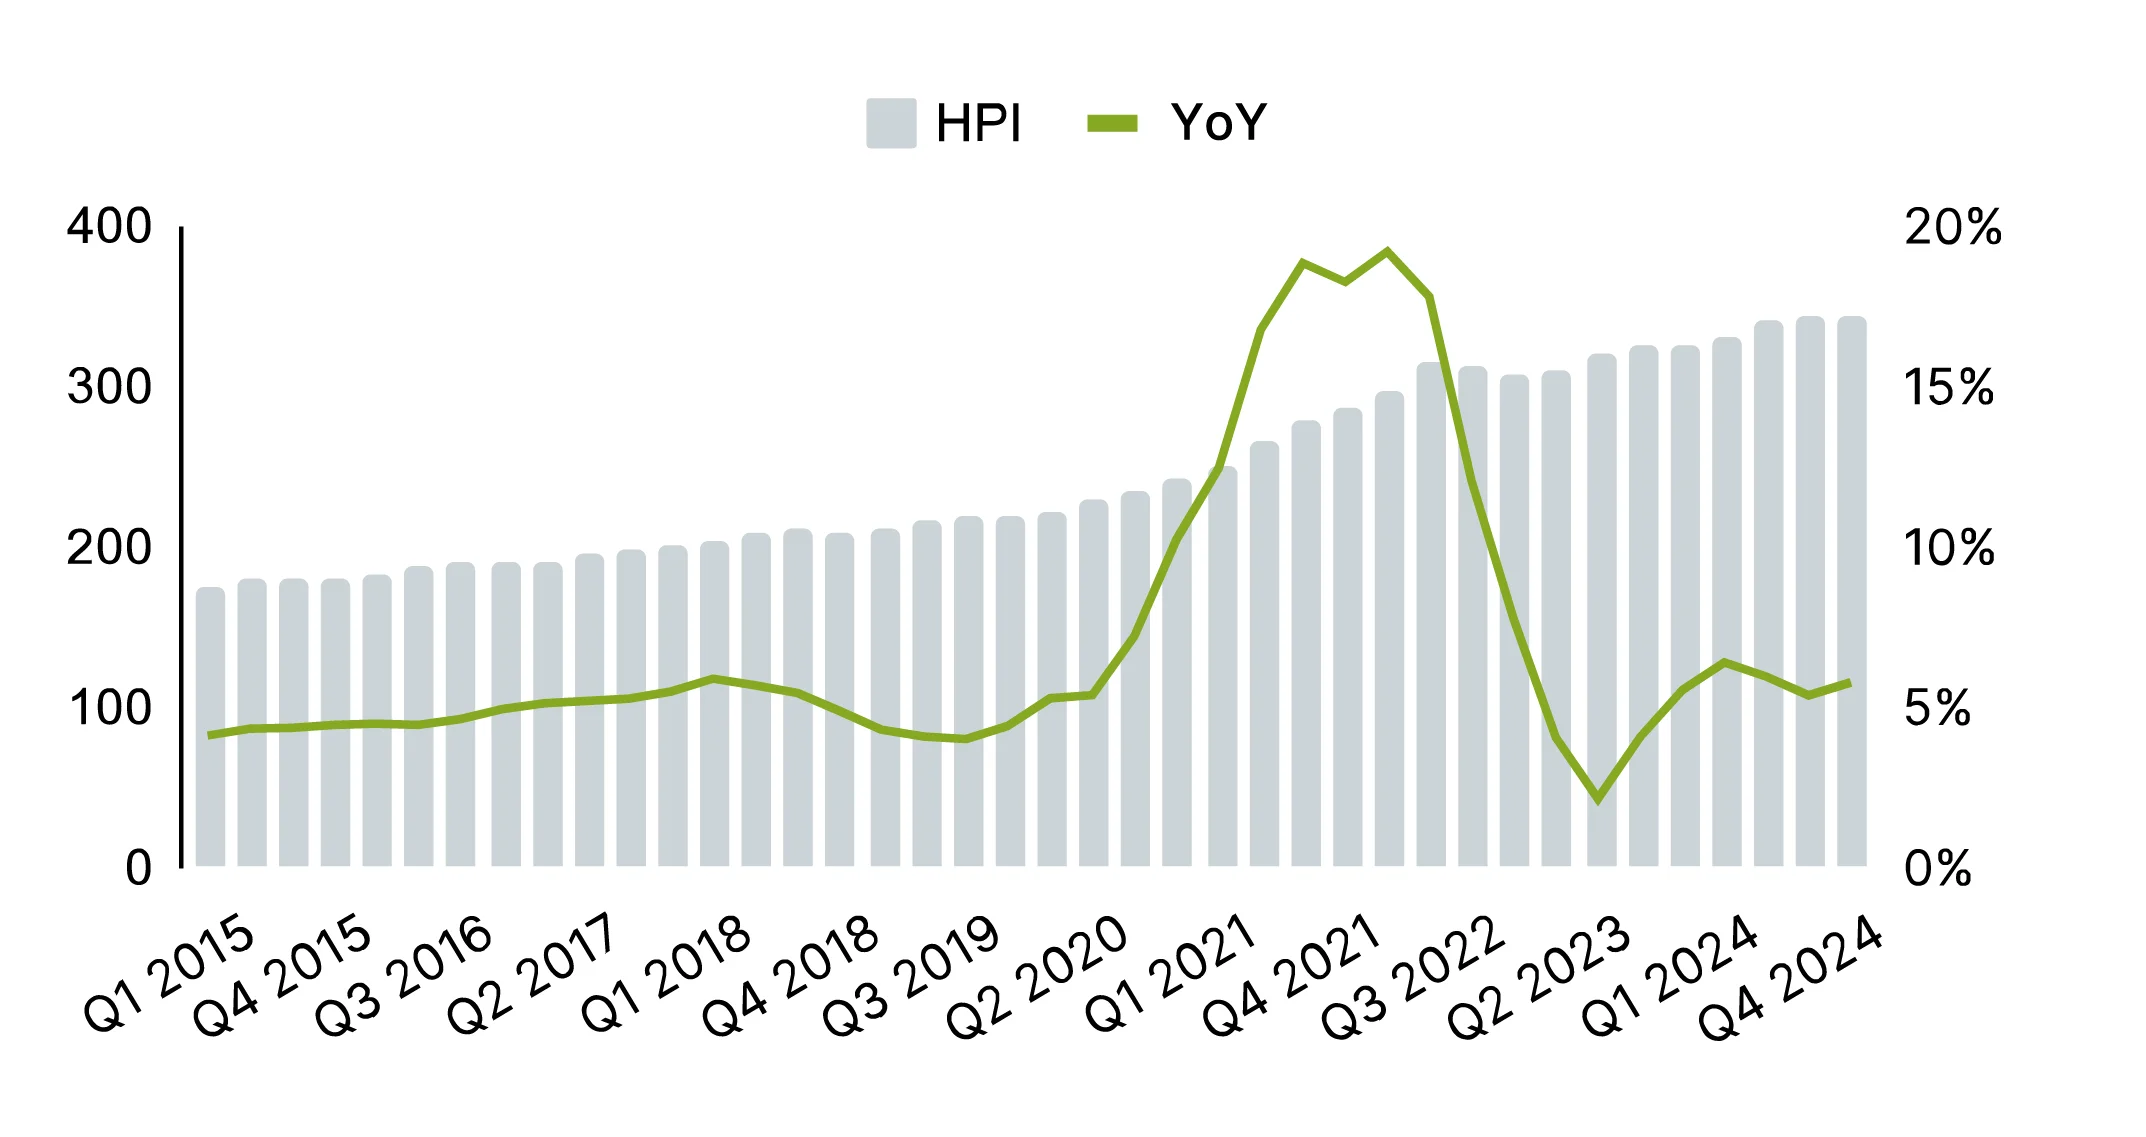
As home values hit record highs in 2024, homeowners are more willing to invest in repairs, upgrades, and remodeling. Single-family home prices jumped 5.8% in Q4 of 2024, boosting home equity and giving people more value to borrow against. According to Harvard’s Remodeling Futures Program5, home improvement projects will rebound in 2025, as more people buy, sell, and maintain their homes. This steady growth means home service businesses should see strong demand for big and small projects throughout the year.
Home Equity Values ($Trillions)6
Home Price Index7
“We stayed busy in 2024, with no issues booking work—we’re consistently scheduled 12 to 18 months out. The biggest challenge has been finding skilled workers, and that’s not changing in 2025. We raised our rates by $10 an hour last year, but we’re keeping pricing steady for now. Revenue should see a small bump because of the increase, but the labor shortage means we can’t take on much more than we did in 2024. Overall, we’re feeling good about the next year—we’ve got solid projects lined up and a great team to keep things moving.”

Housing Market: Positive Future Outlook
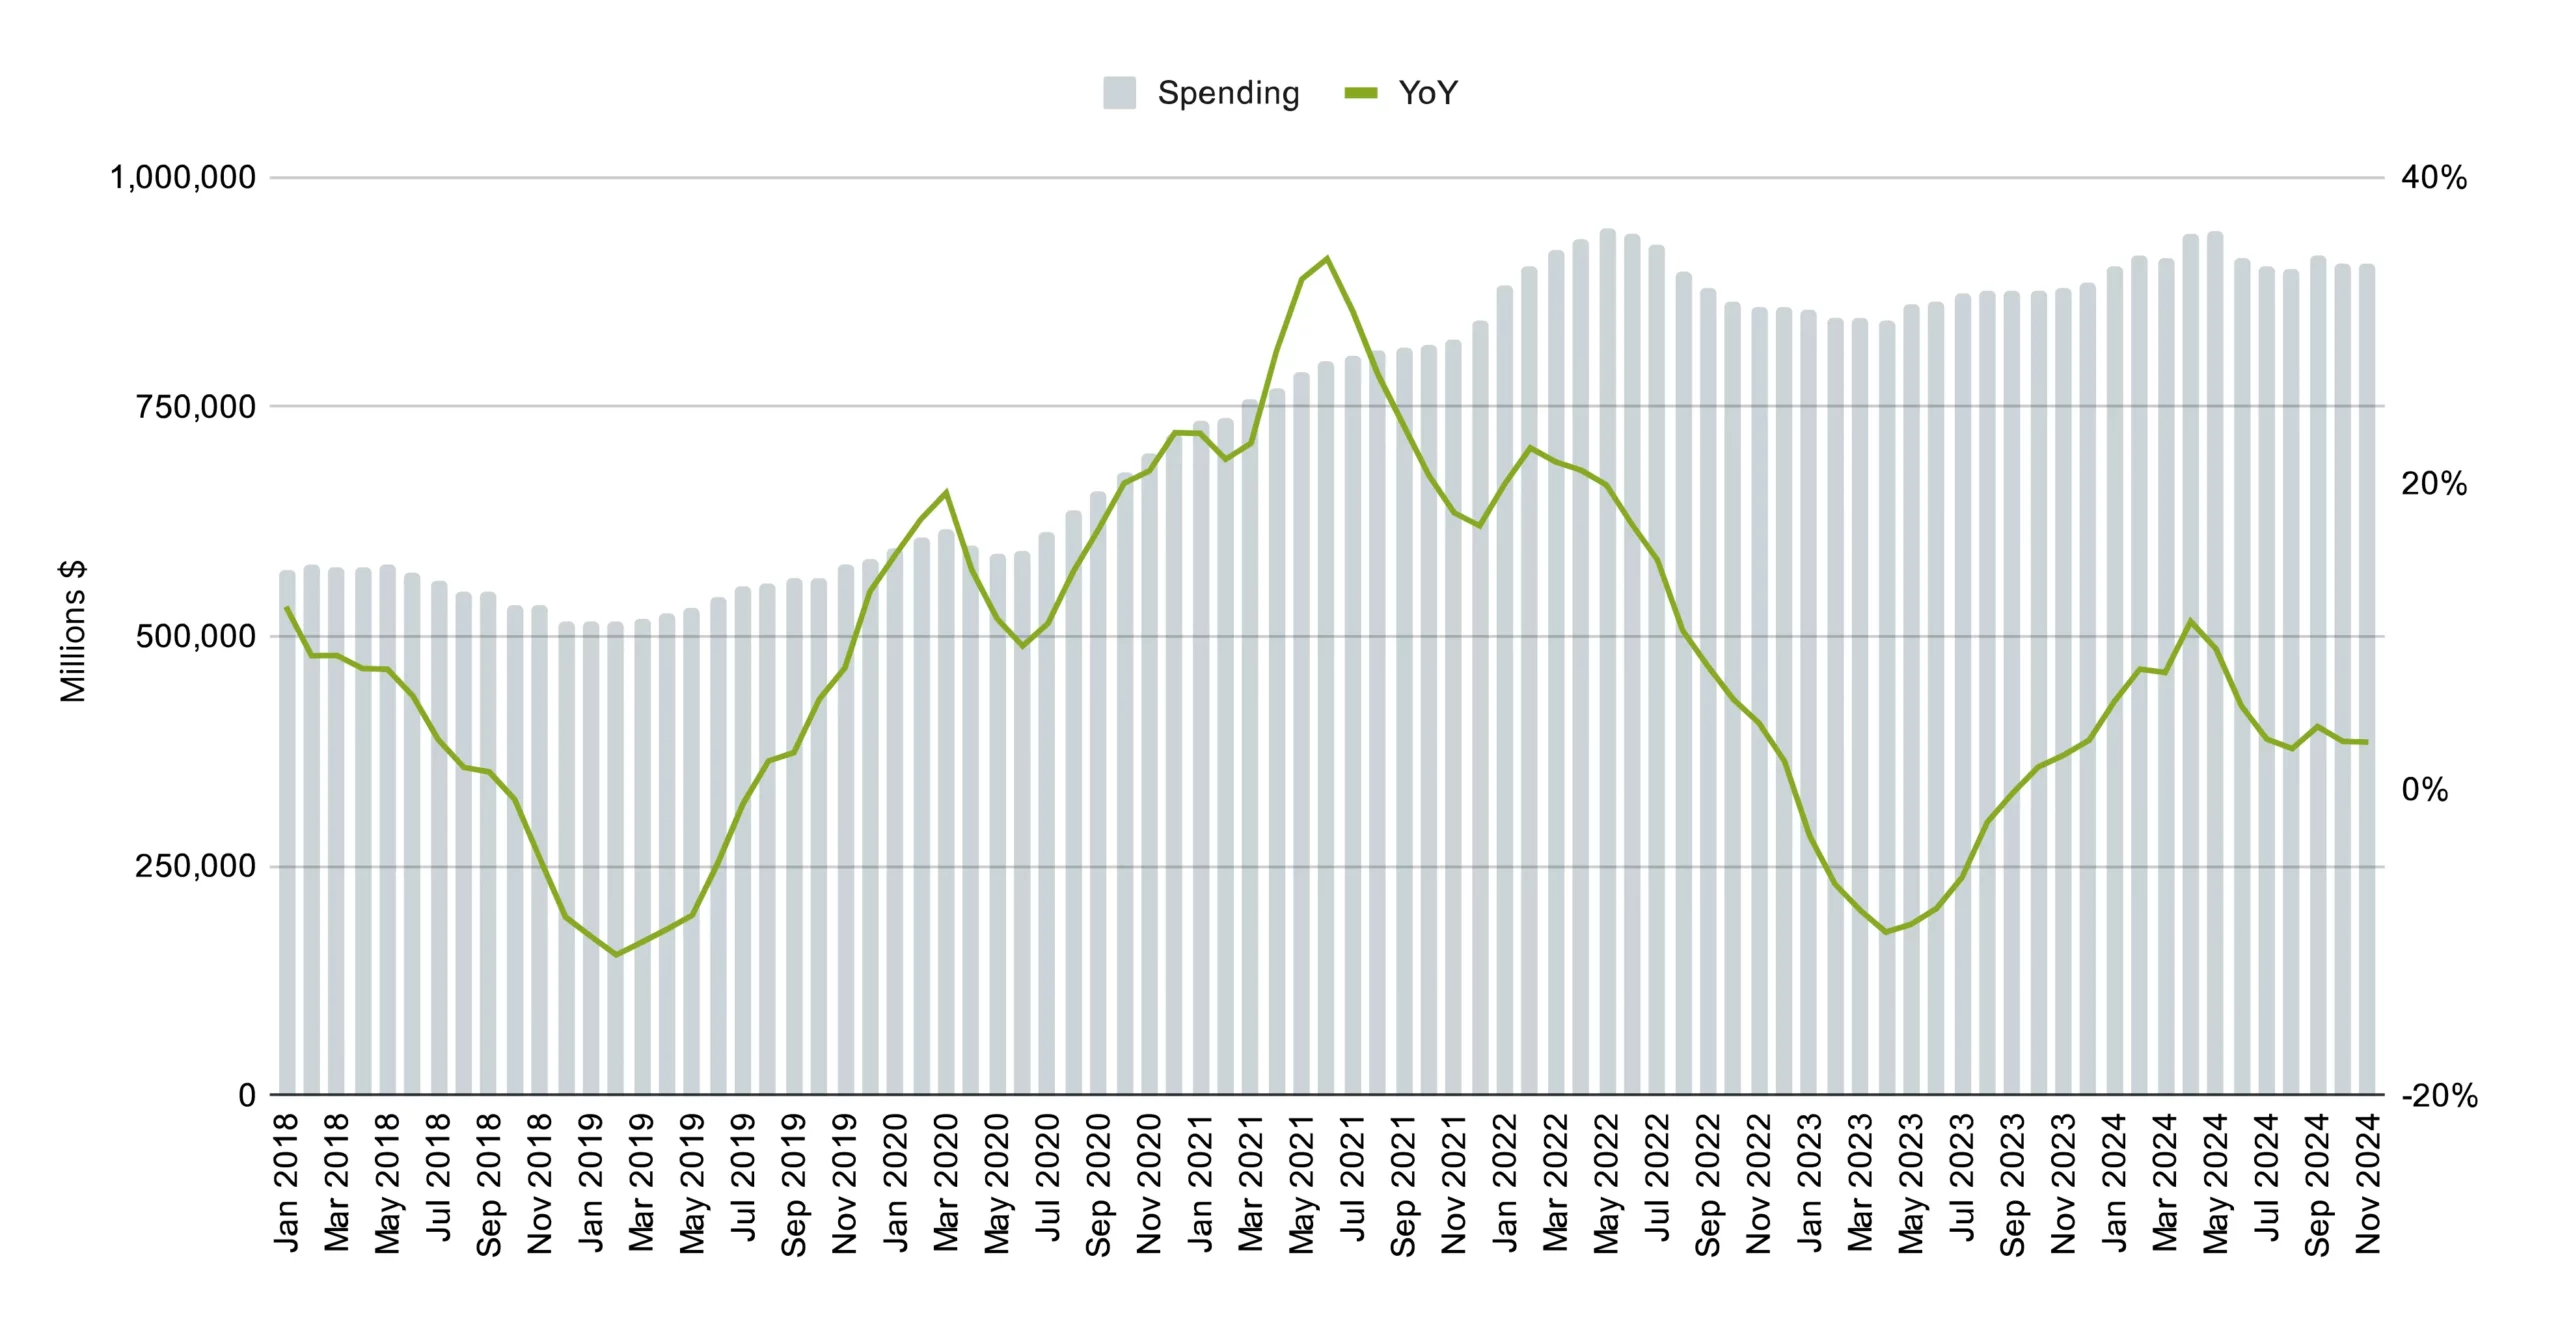
Construction spending rebounded in 2024, maintaining steady growth despite fluctuations in housing permits. While new permits were down, a late-year surge in housing starts suggests renewed demand for new builds. This uptick could translate into more work for the home services space, as homes enter active construction in early 2025.
Monthly Construction Spend ($Millions)8
Housing Starts YoY ($Millions)10
Housing Permits YoY9
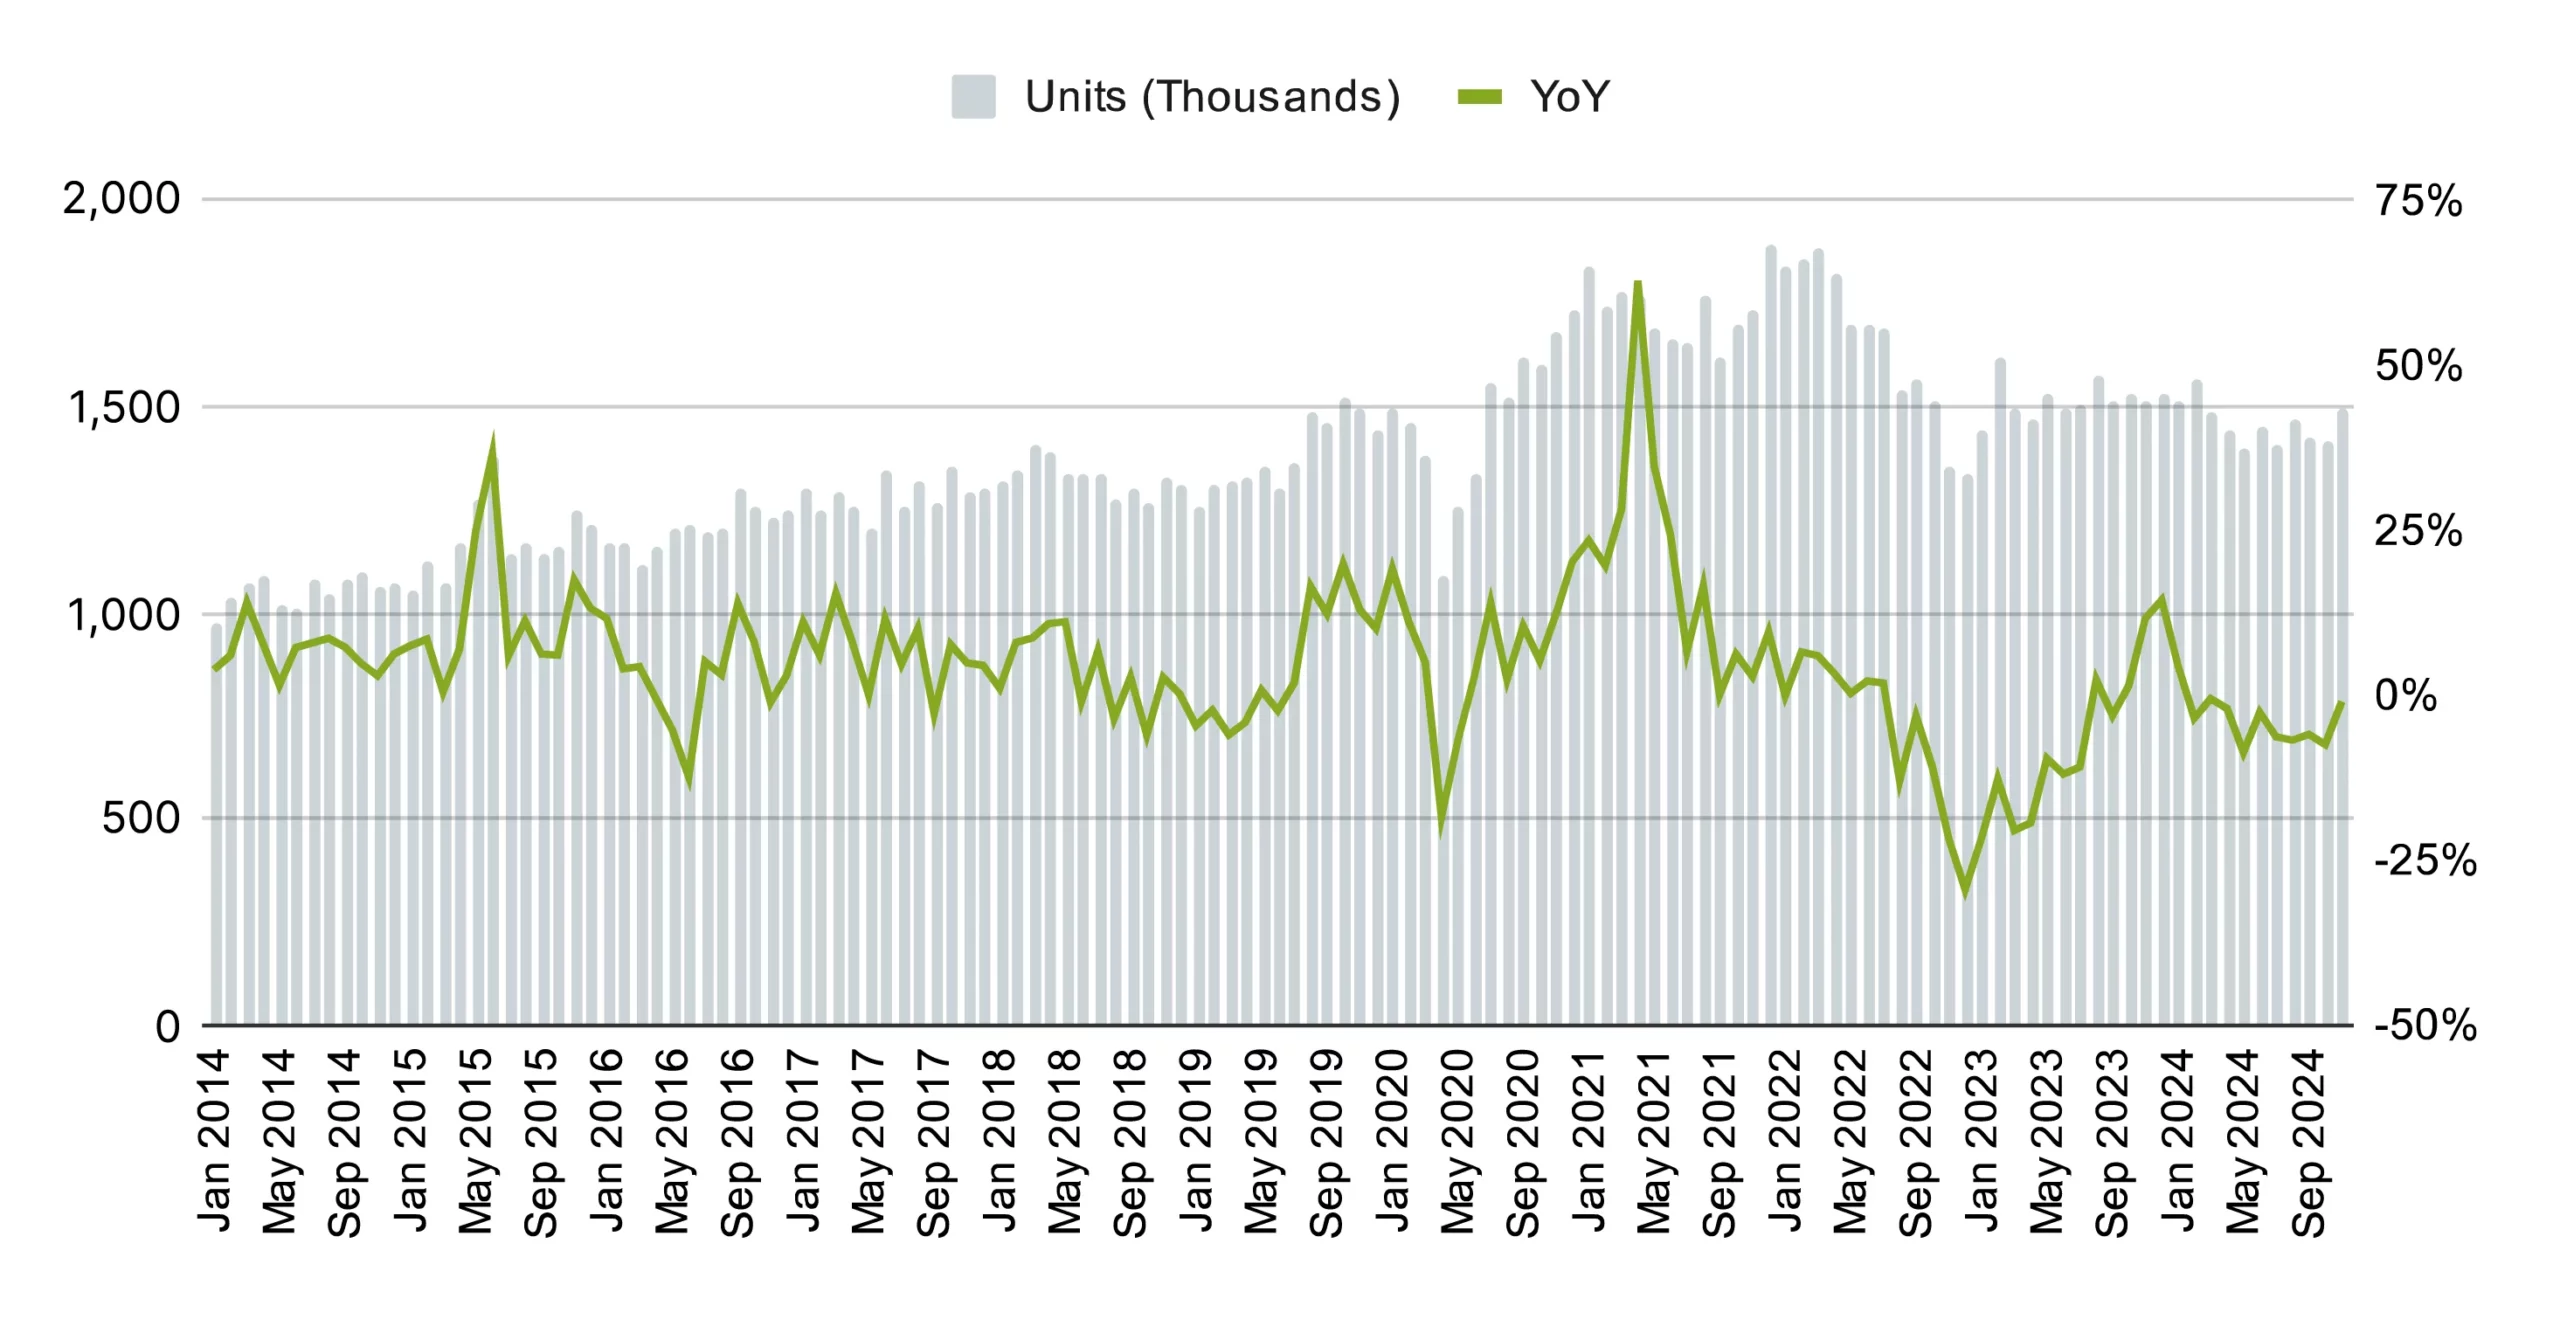
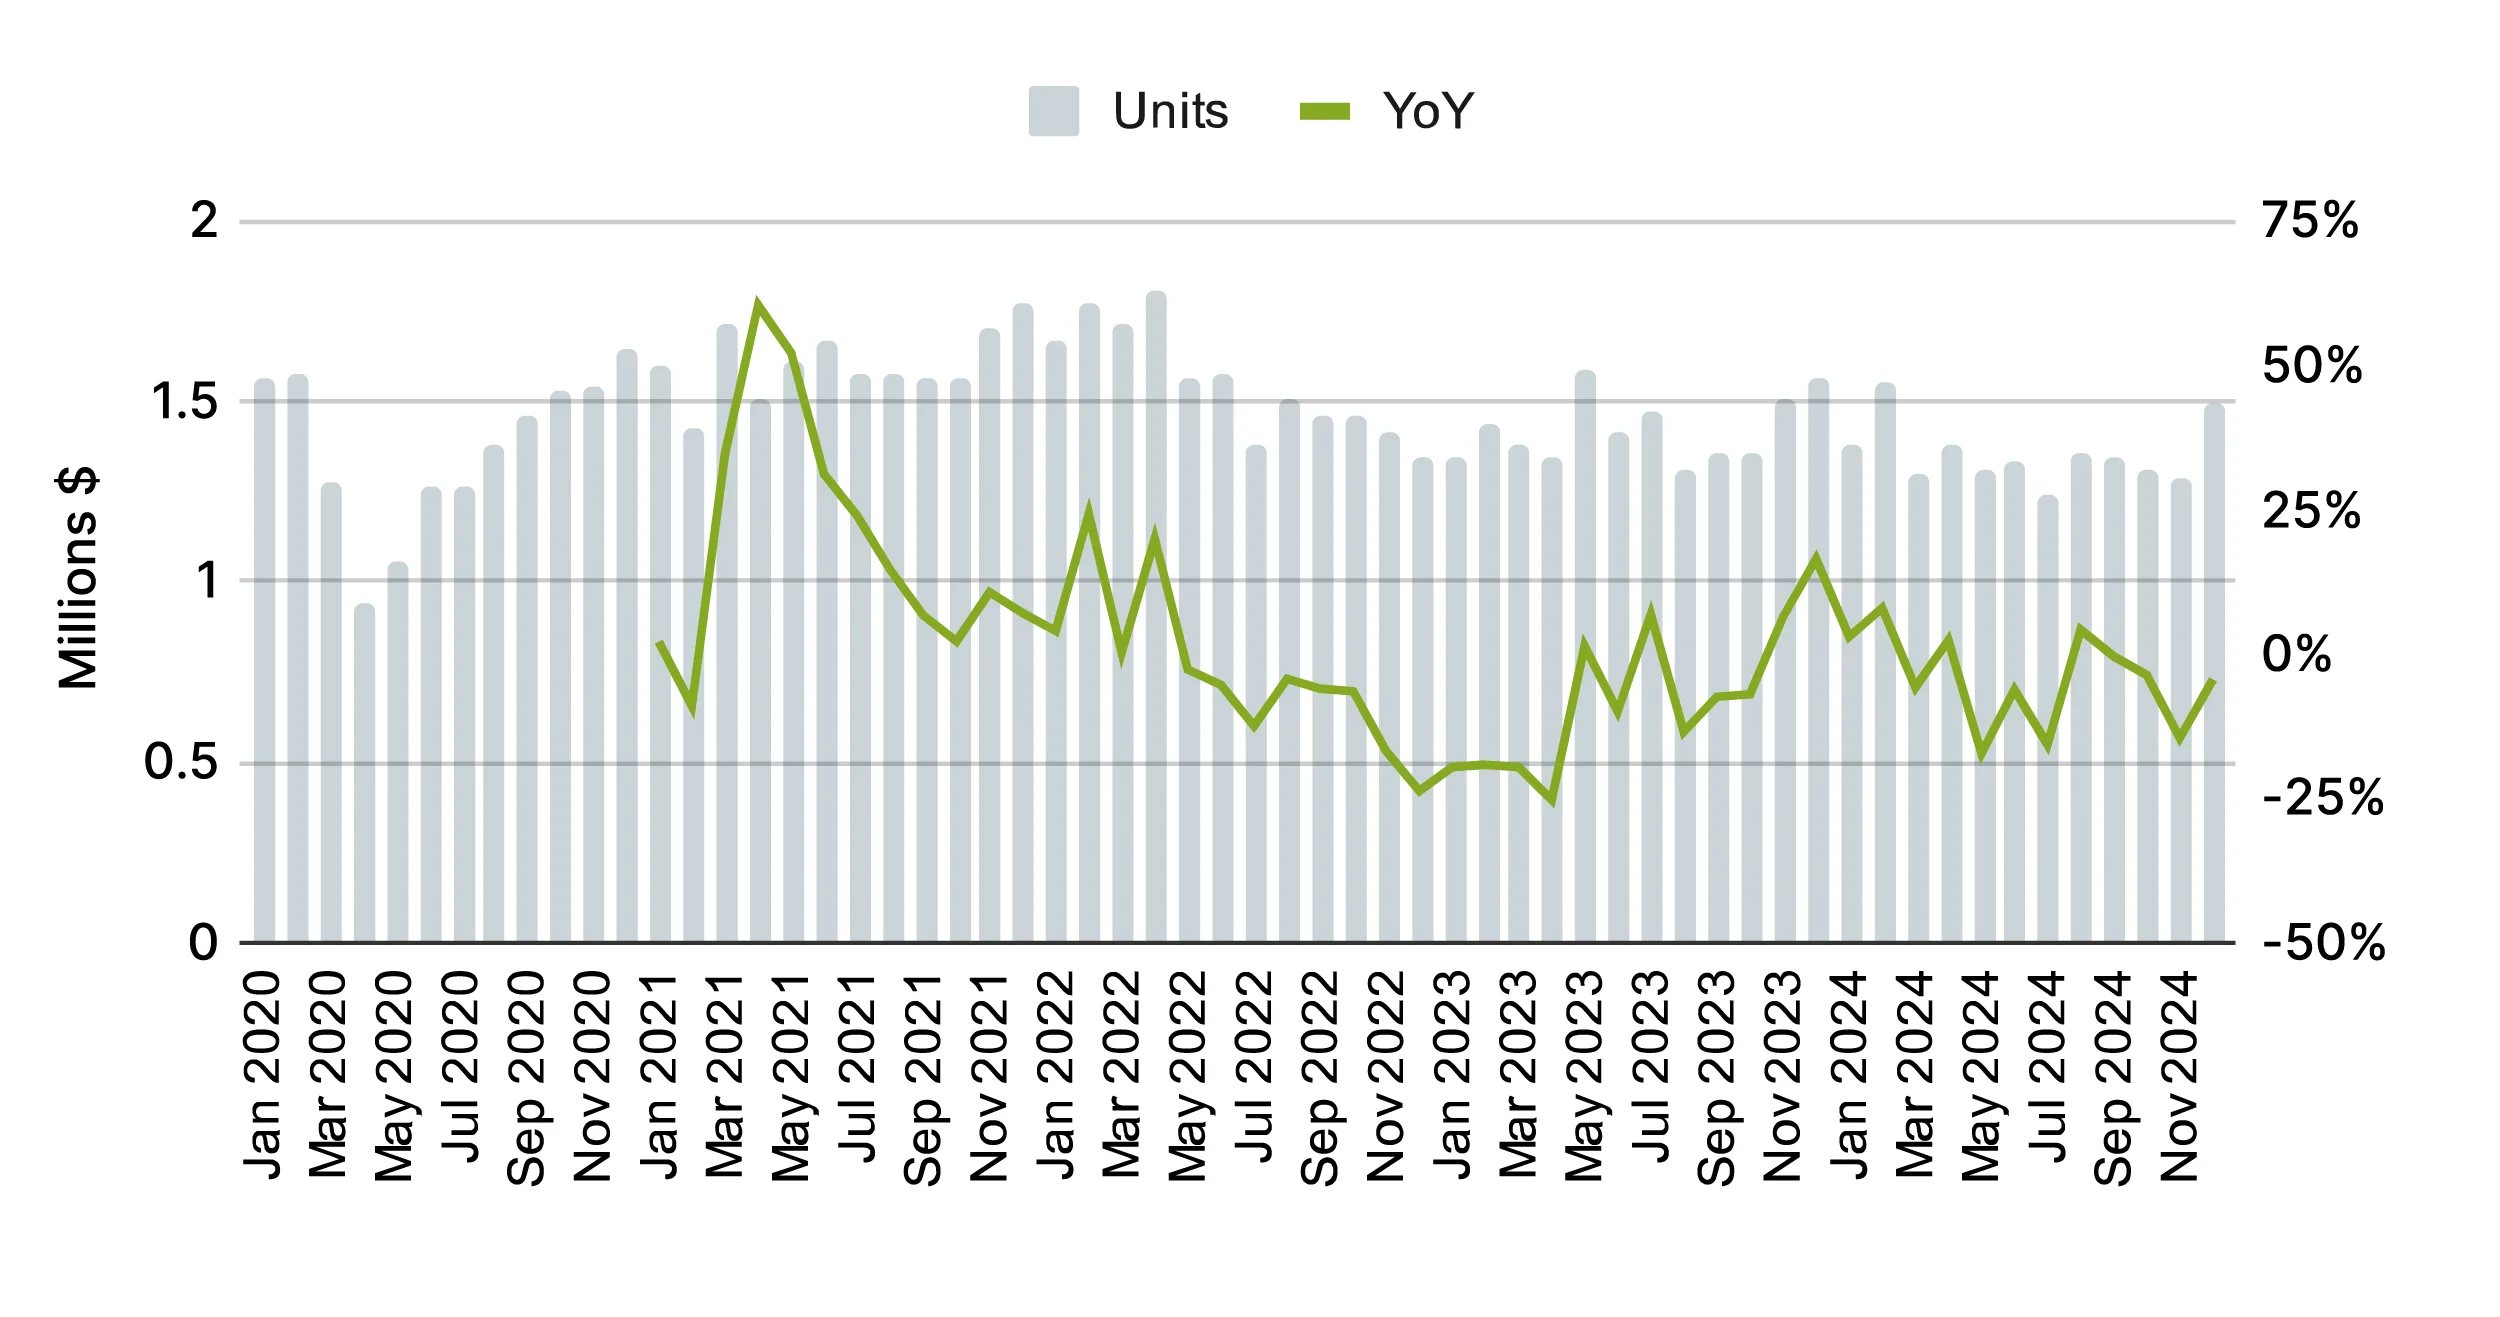
While high mortgage rates slowed existing home sales, new construction remained resilient, with a 2.5% growth in new home sales due to competitive pricing and availability. For Home Service professionals, this means more opportunities in new builds and a growing backlog of maintenance and improvement projects for homeowners staying put.
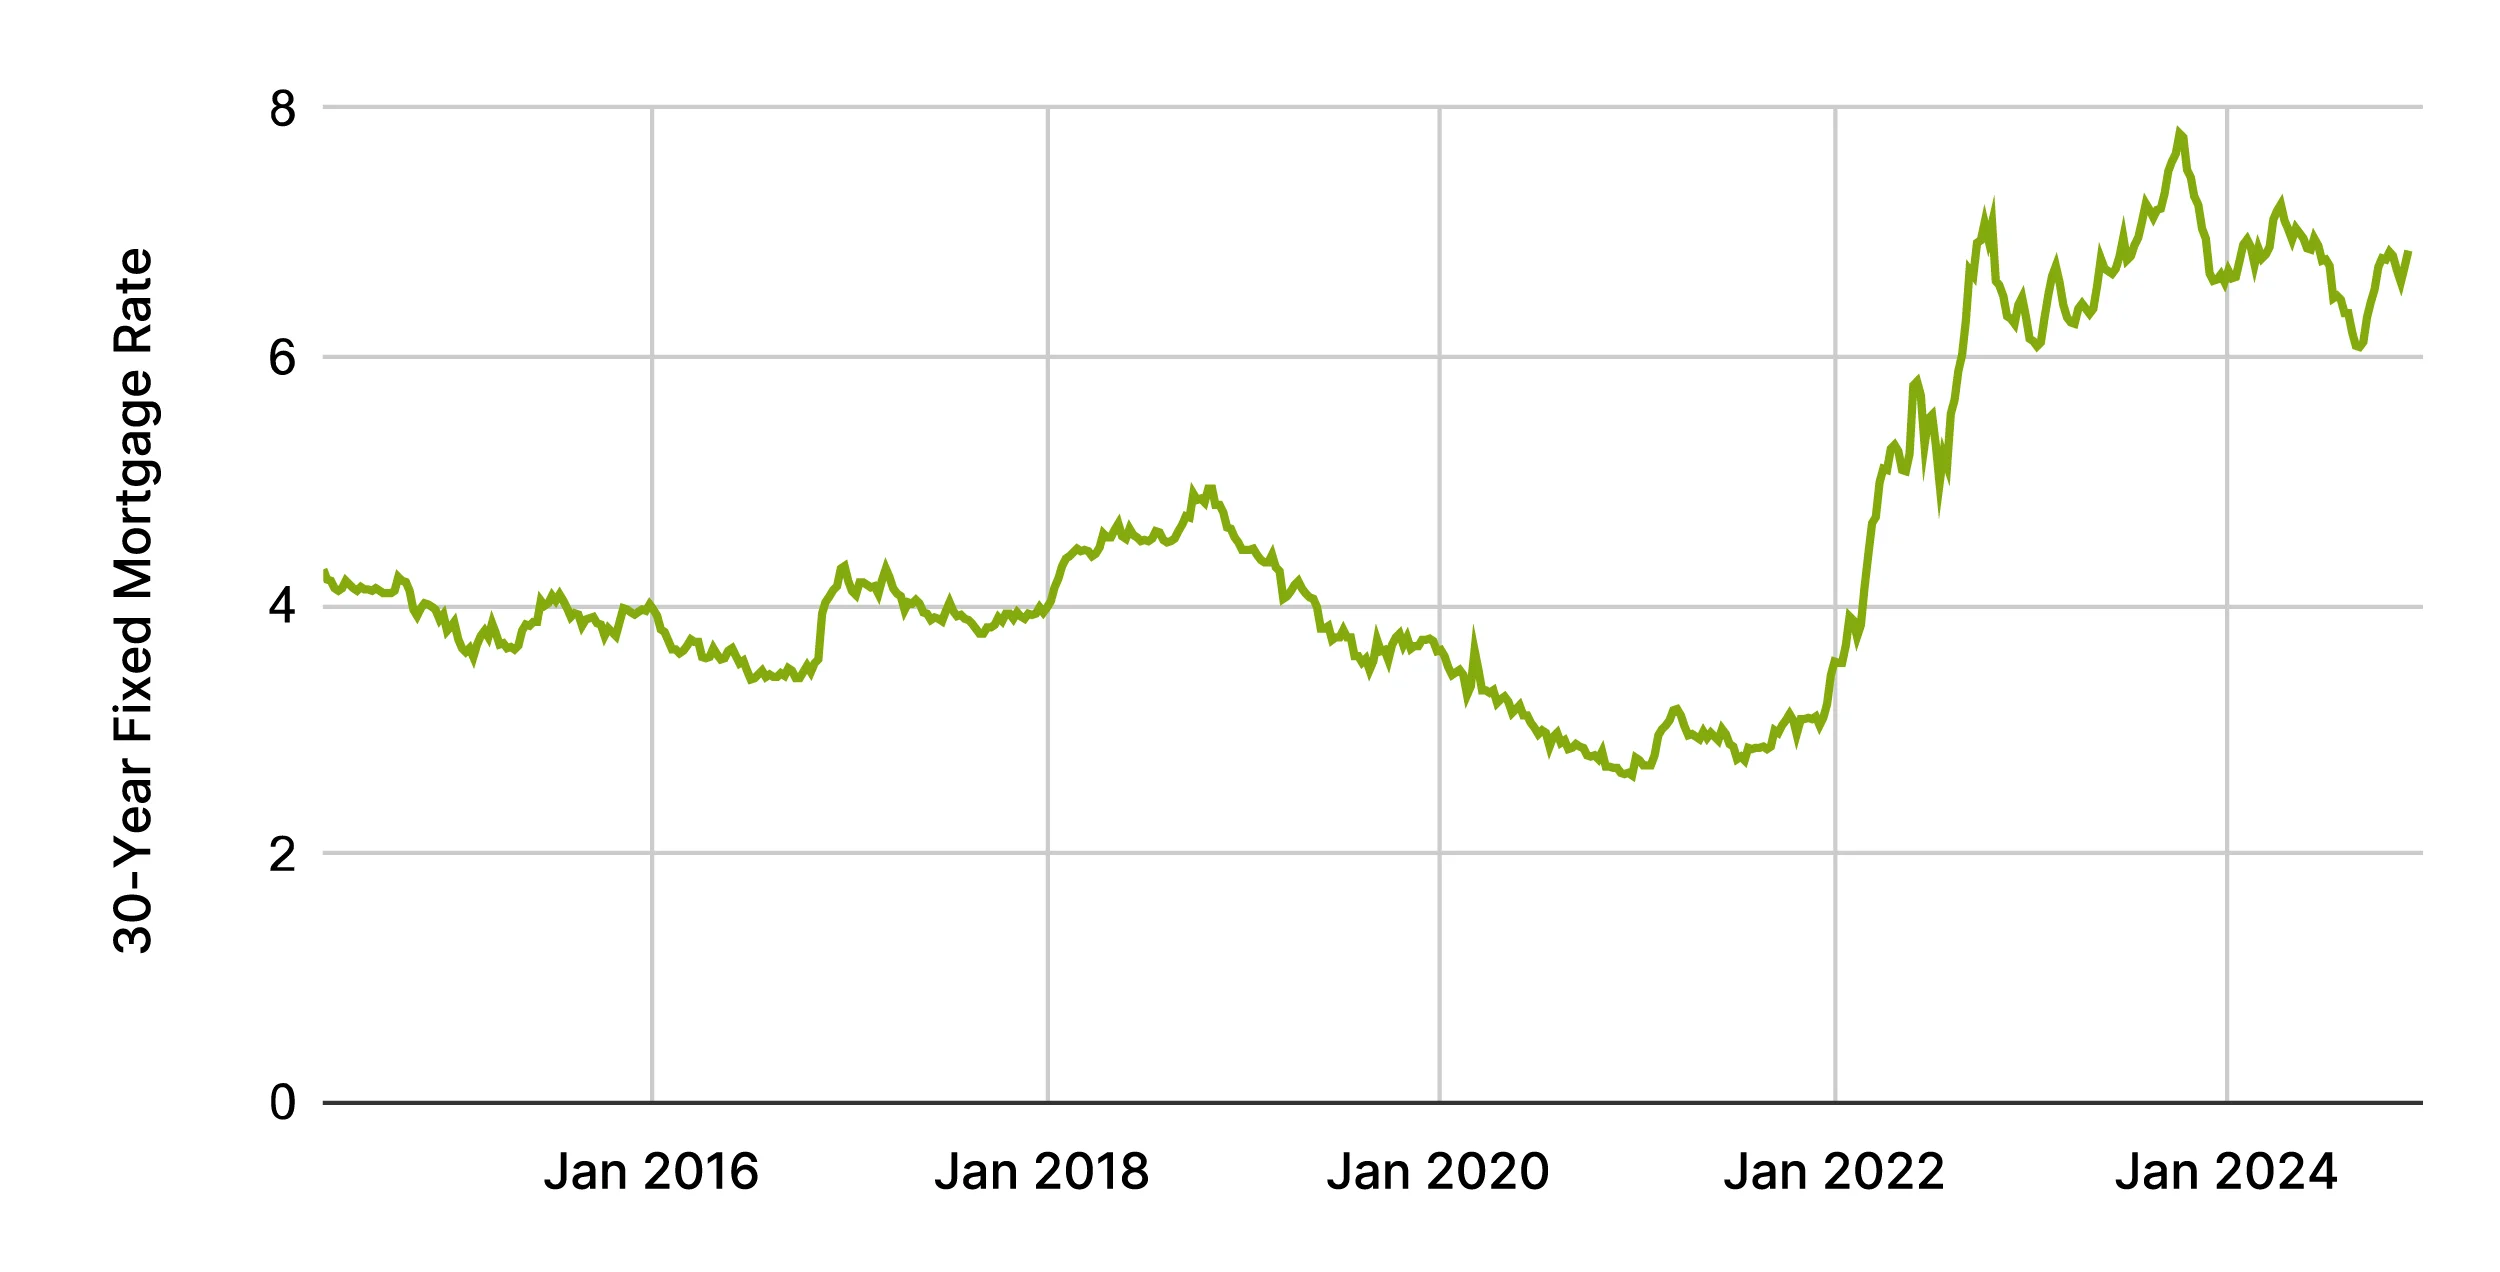
Fewer homeowners moving meant a slowdown in immediate renovation projects for Home Service businesses. However, steady home sales present long-term opportunities for investment in upgrades and maintenance. Despite the high borrowing costs, the end-of-year surge in both existing and new home sales provides optimism for the new year.
Average 30-Year Fixed Mortgage Rate11
New Home Sales ($Millions)13
Existing Home Sales ($Millions)12
Home Service Category Performance
Green
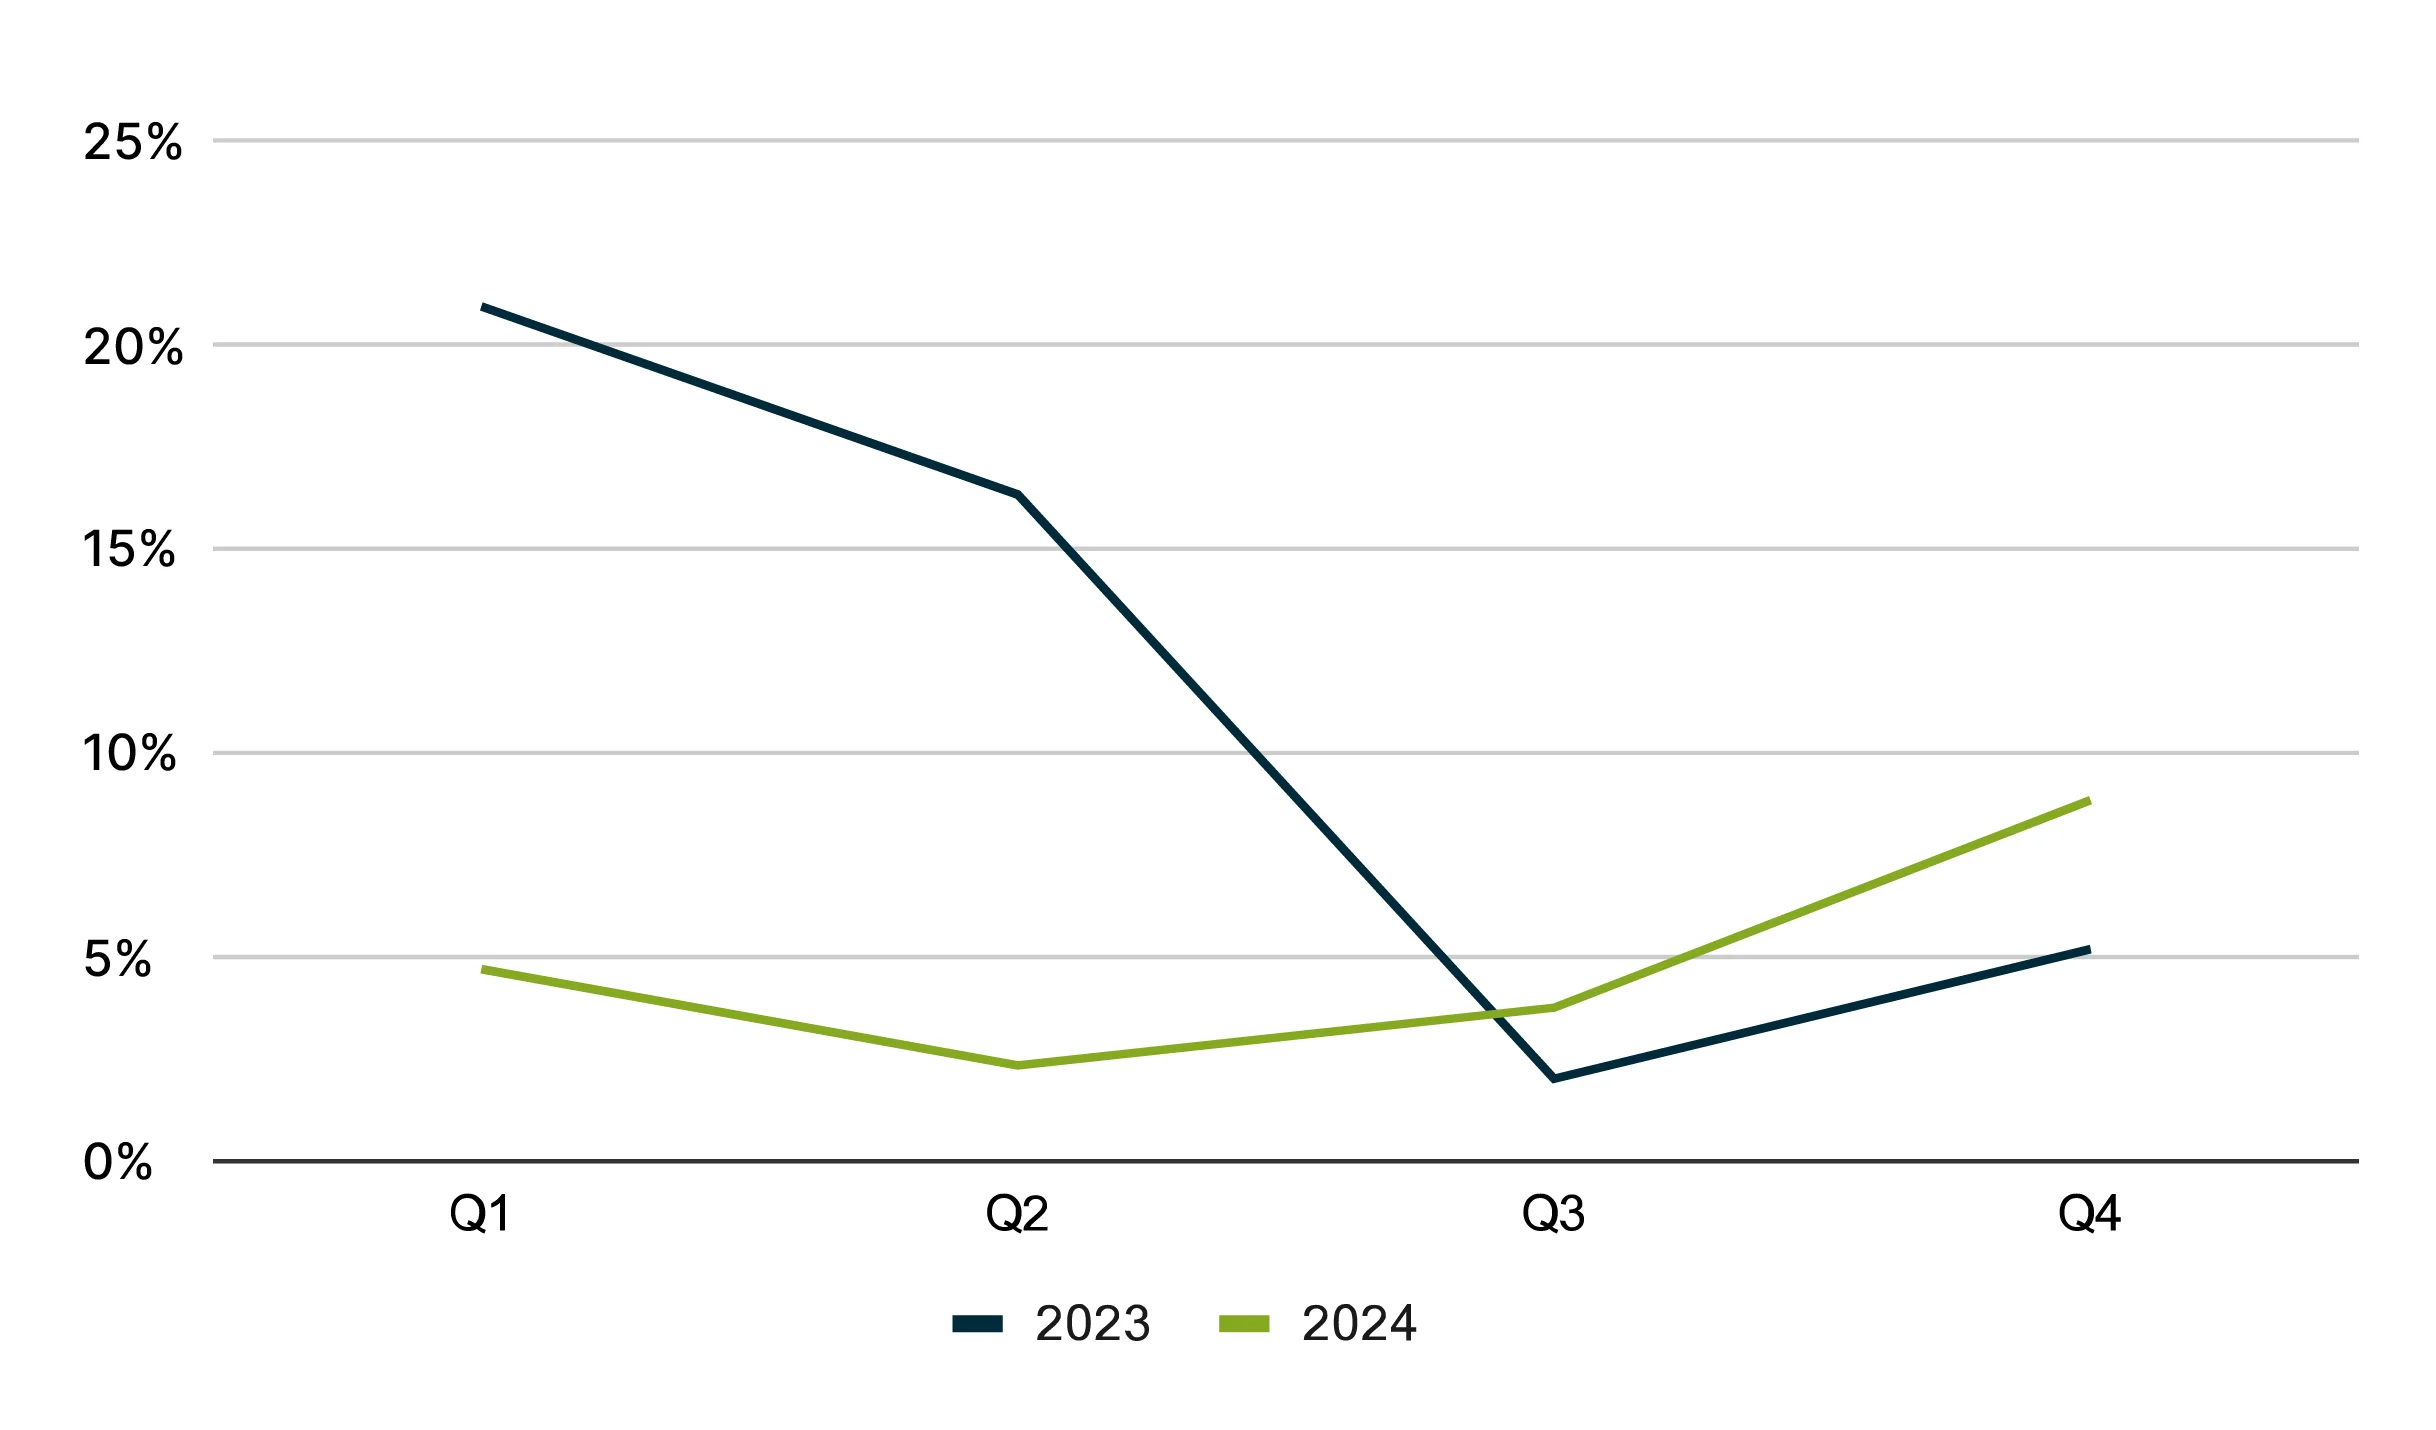
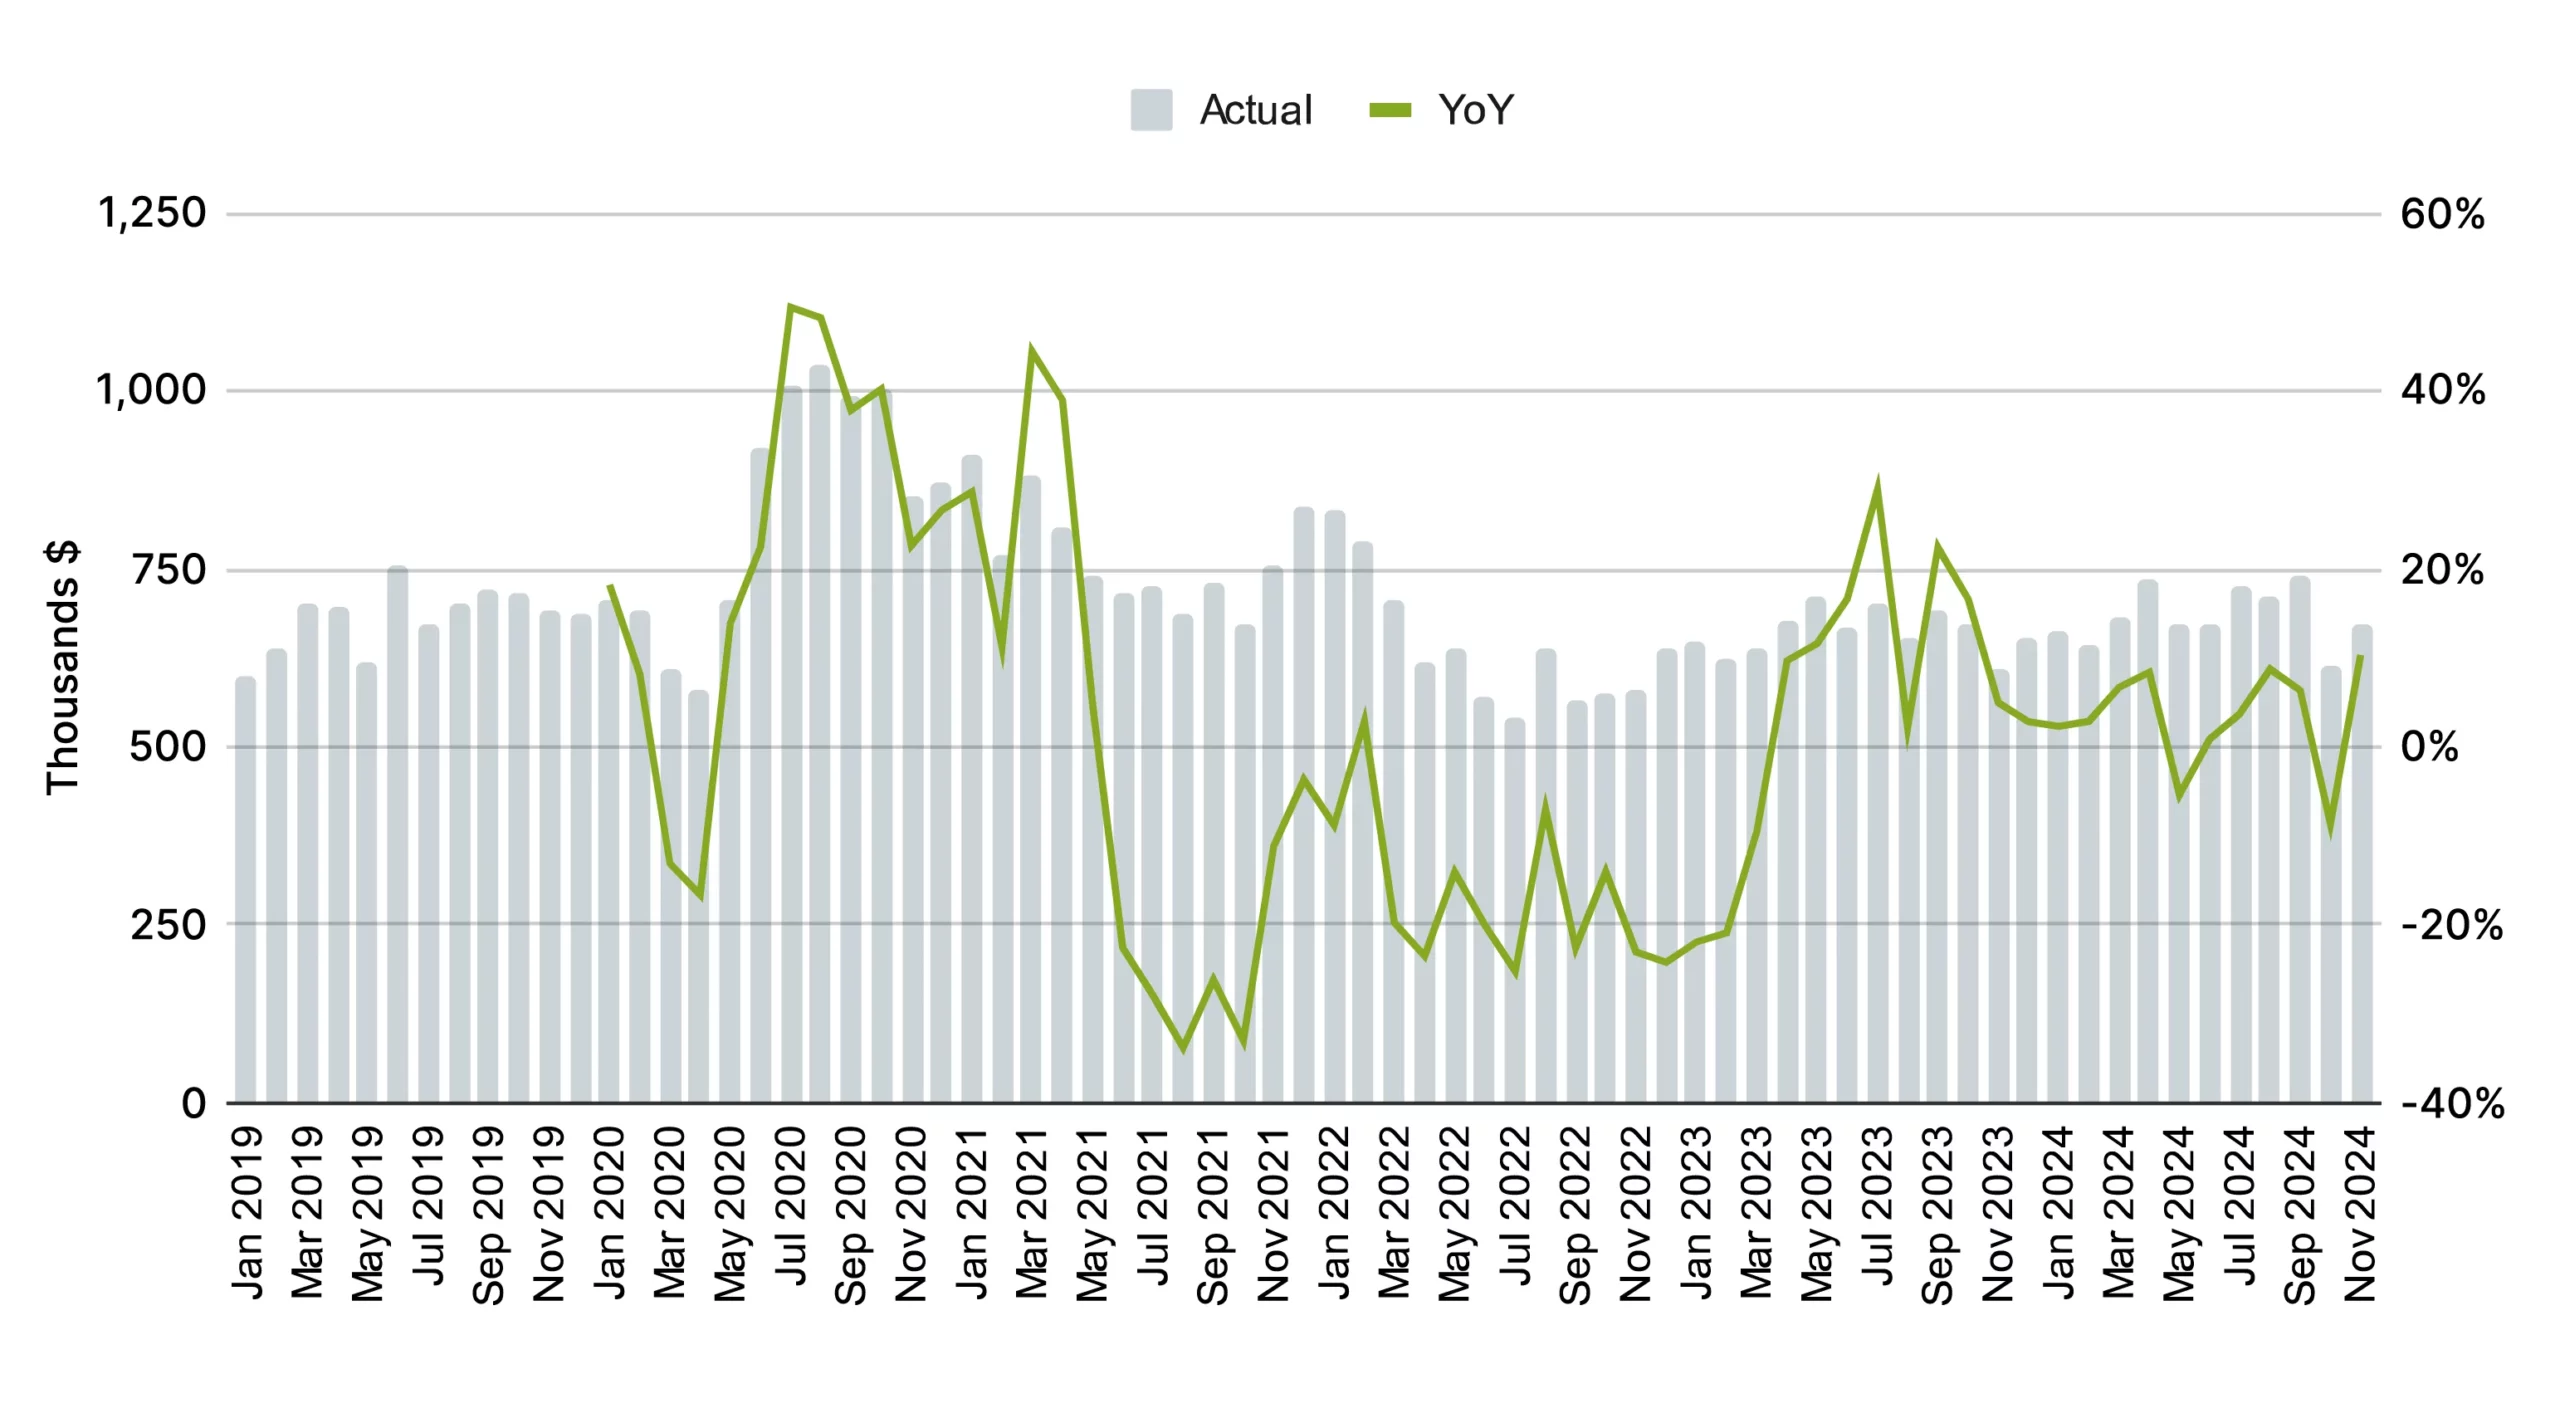
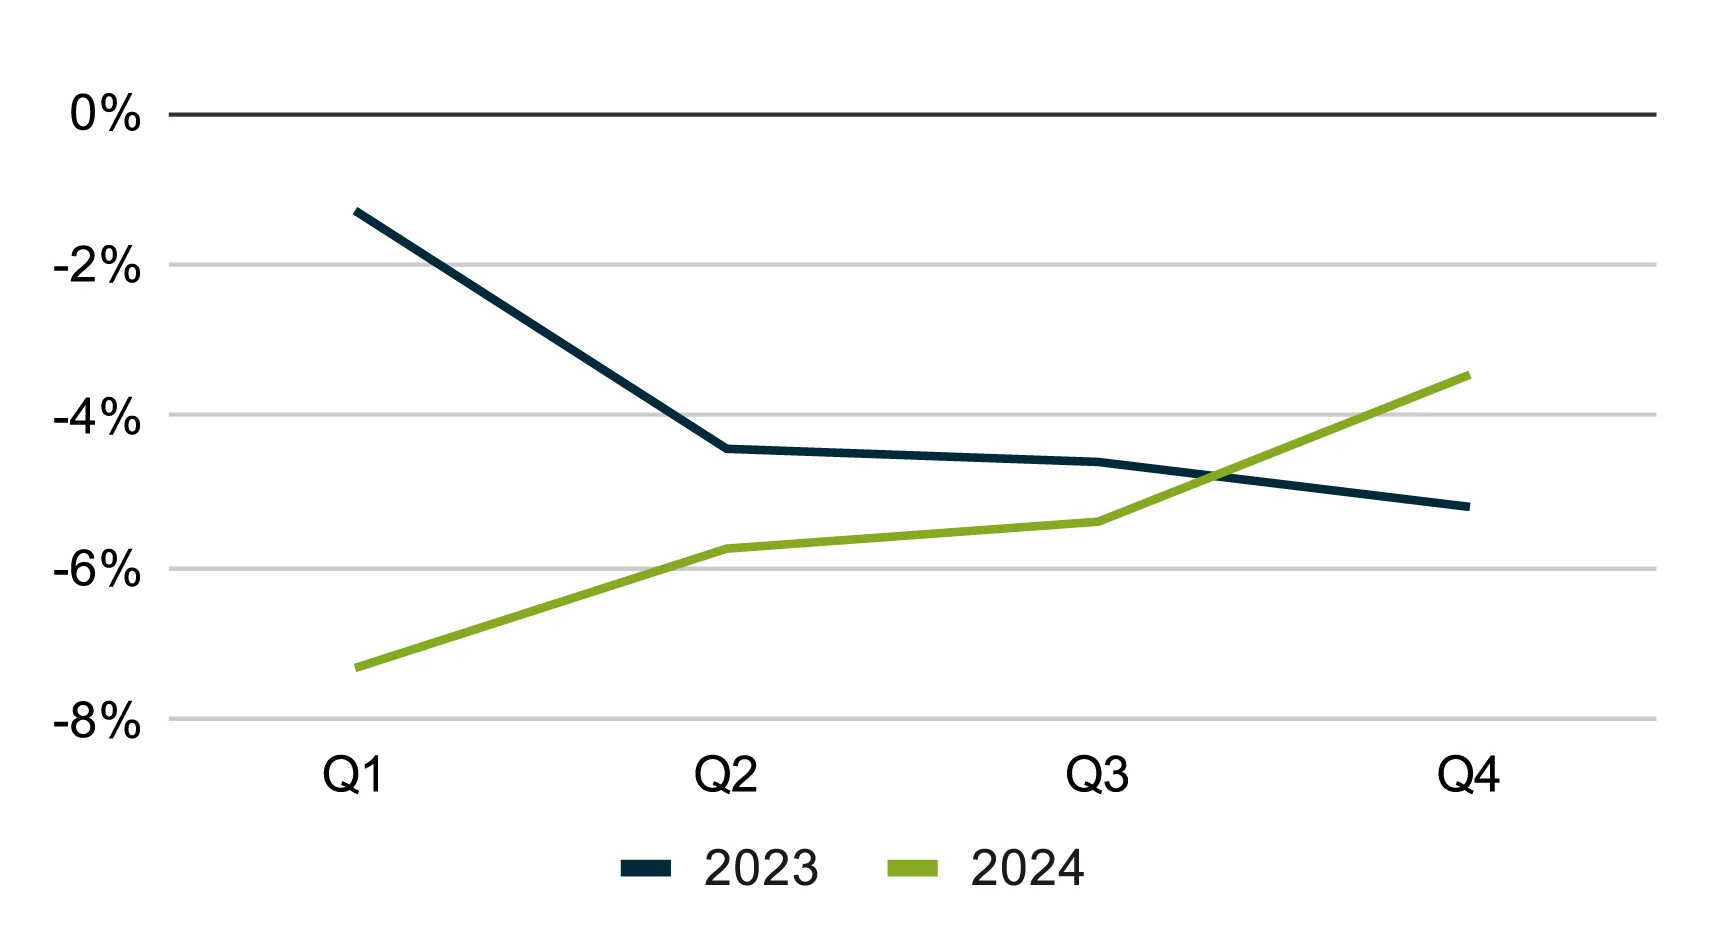
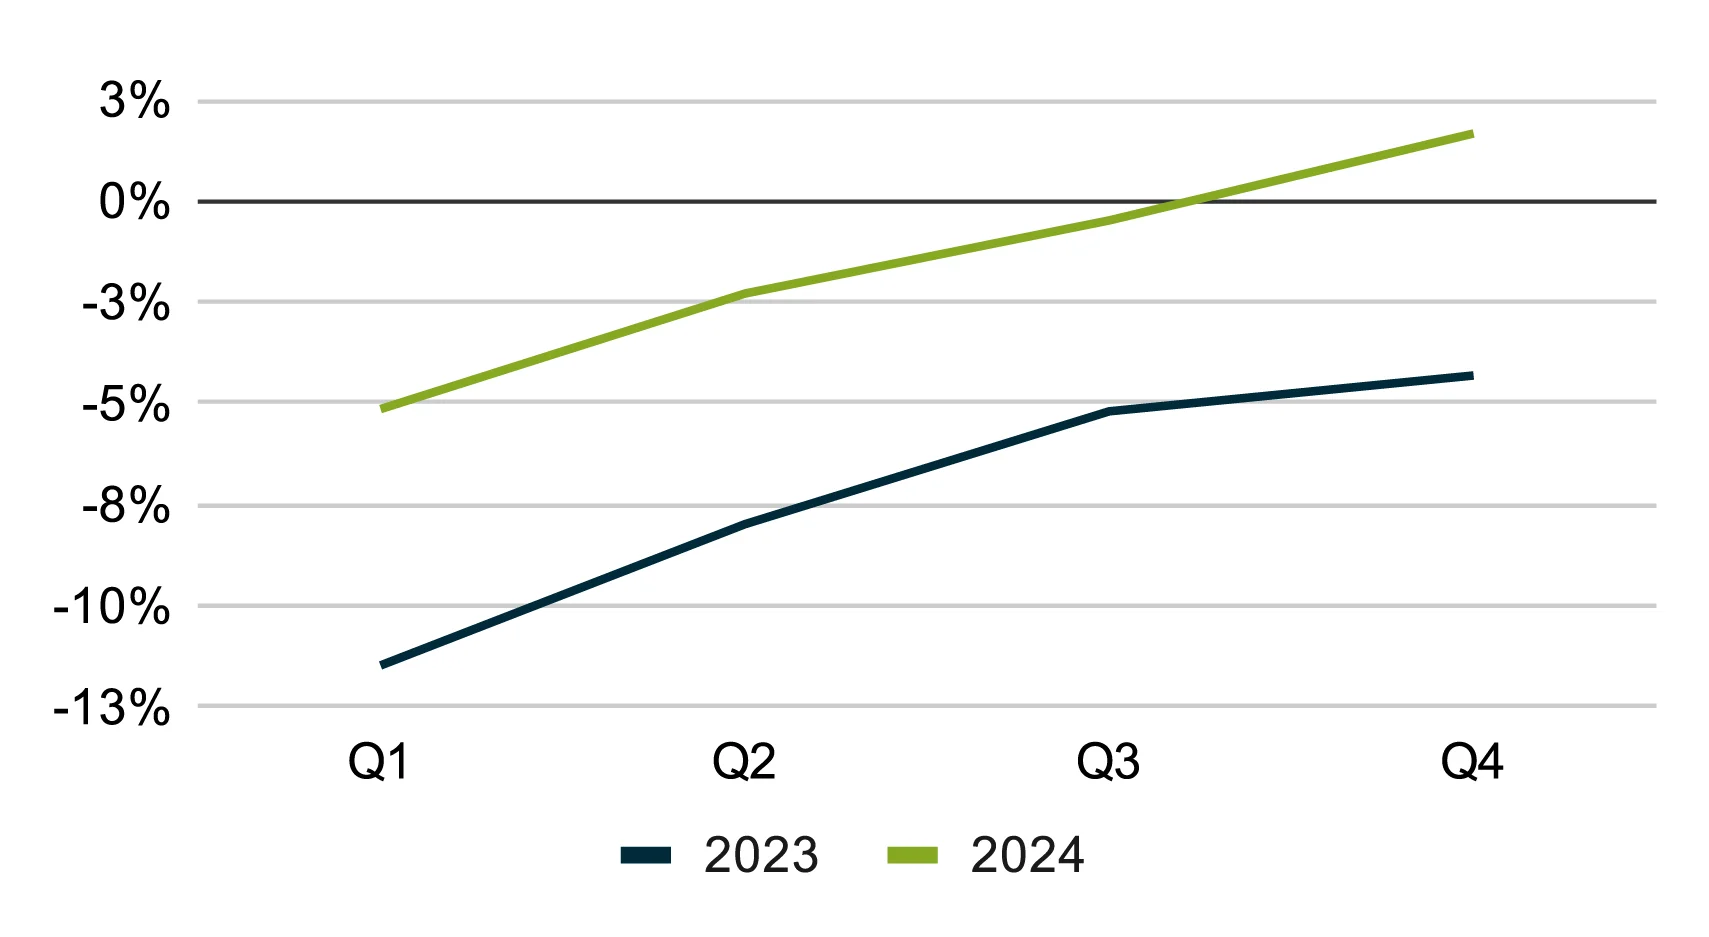
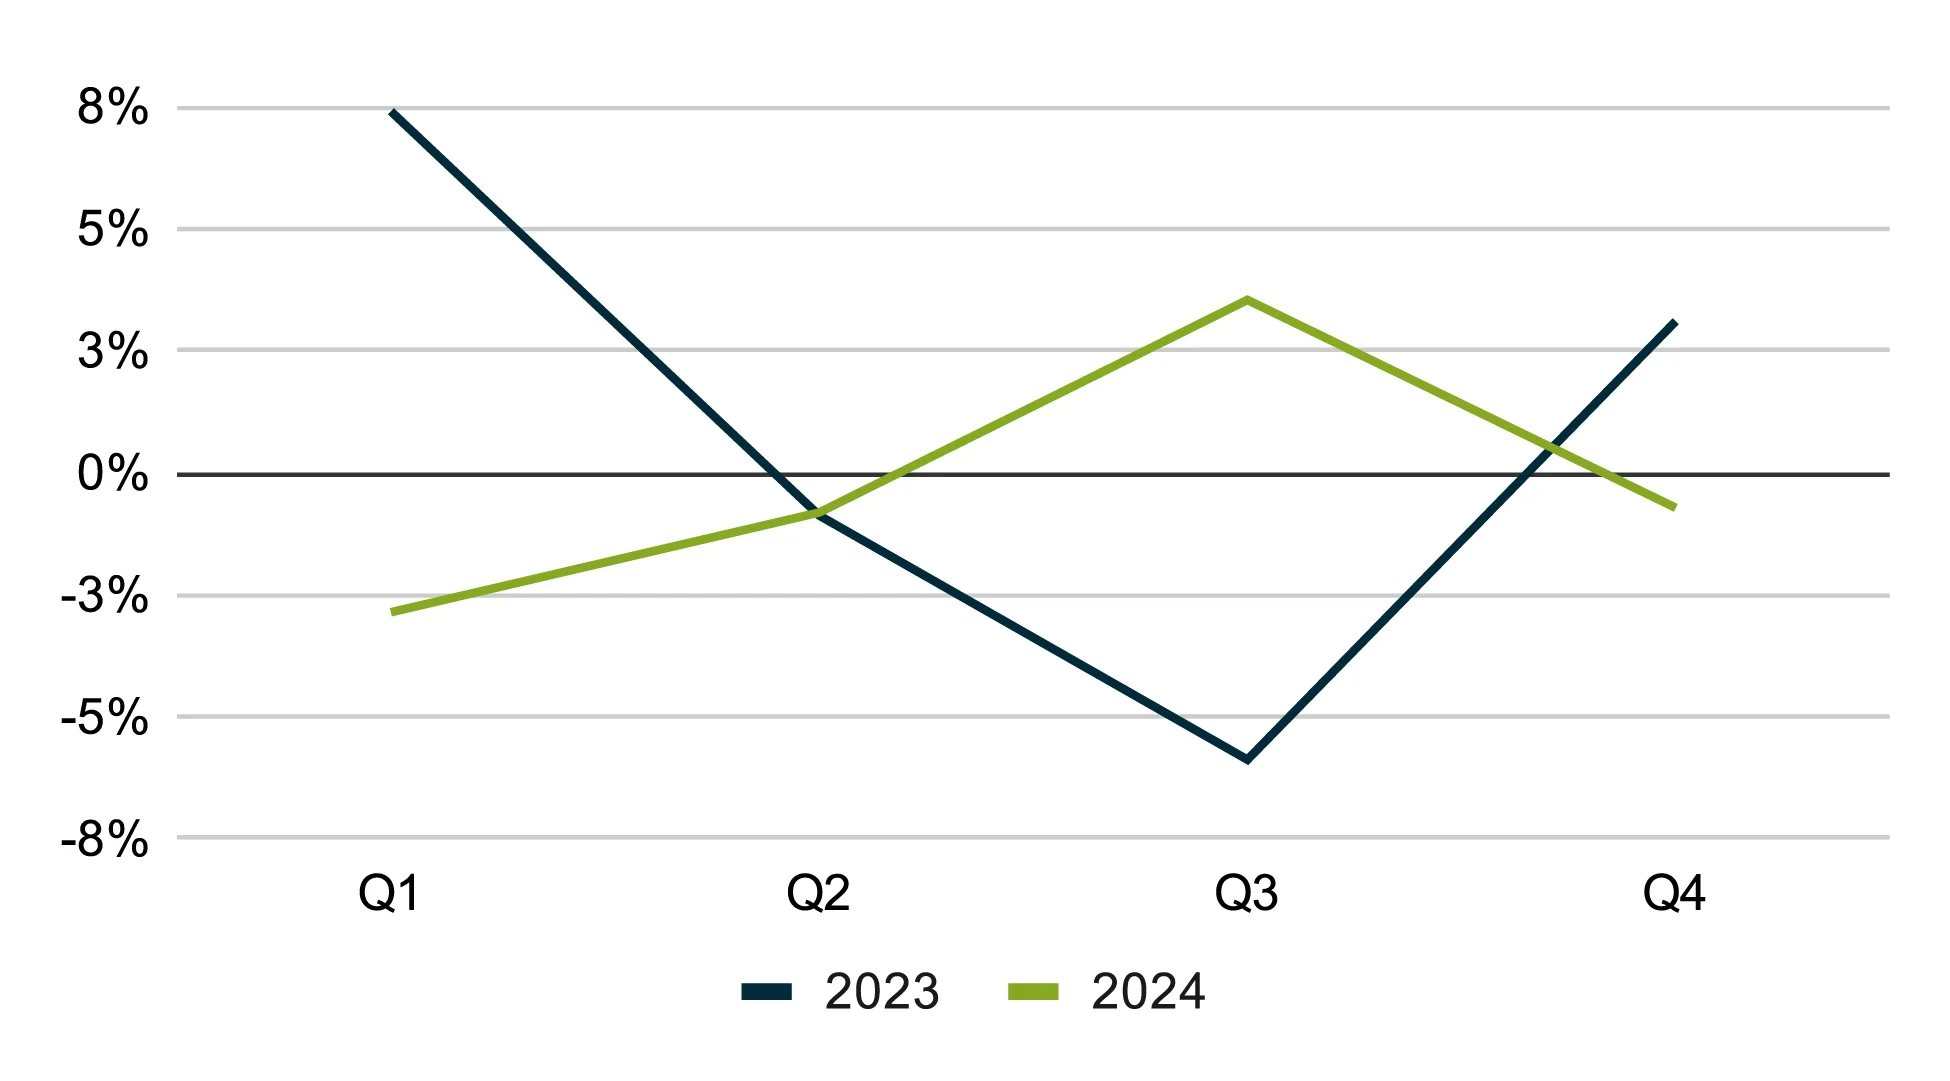
The Green segment includes lawn care, landscaping, and other related outdoor services. The Green sector experienced volatility in 2024, with new work scheduled dropping sharply in the spring before rebounding later in the year. Median revenue followed a similar pattern, dipping early on but recovering towards year-end, suggesting businesses balanced fewer projects with higher-ticket services or price adjustments. While demand fluctuated more than in 2023, the sector finished strong, indicating positive momentum heading into 2025 for landscaping and lawn care services.
New Work Scheduled YoY — Green
Median Revenue YoY — Green
“2024 was a challenging year for booking new work—people were more hesitant to spend on landscaping. On top of that, finding and retaining help was a struggle. But we kept pushing forward, adjusting our pay scale, and increasing our service prices to stay competitive. Looking ahead, I’m optimistic about 2025. We’re already getting calls this winter from customers eager to book projects, and we have jobs lined up well in advance. I believe the upcoming season will be strong for sales and growth.”

Cleaning
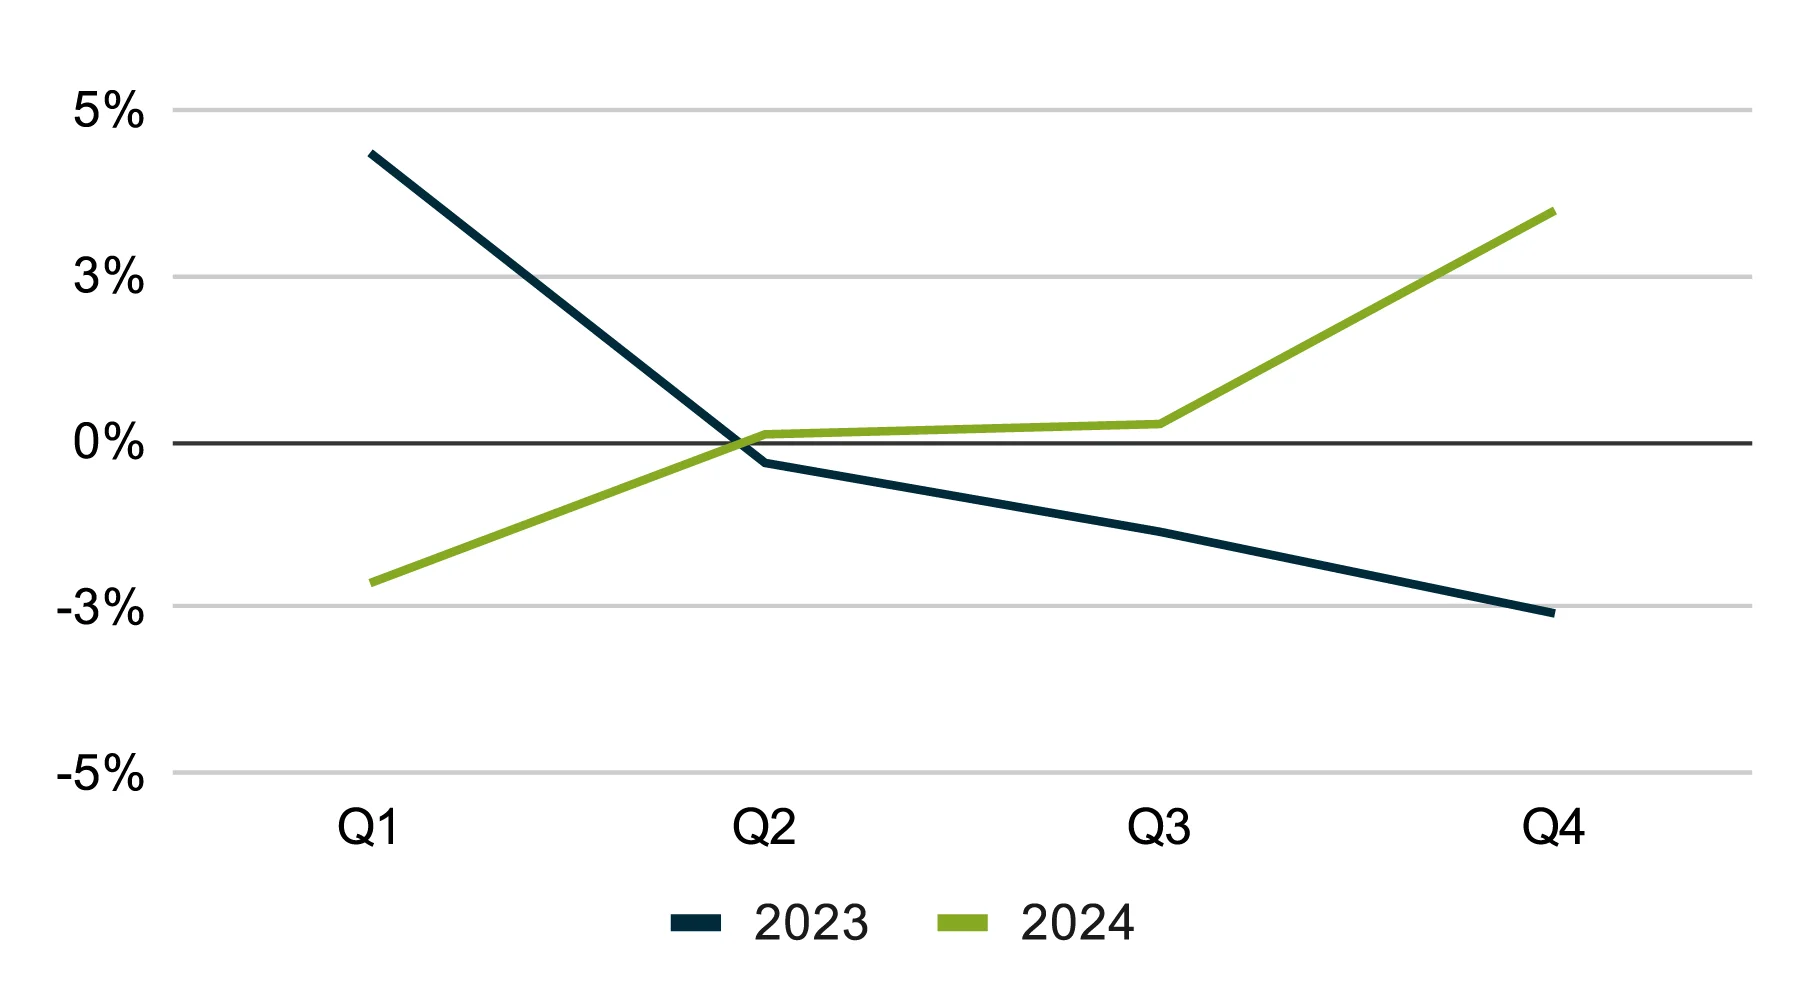
Cleaning services include residential and commercial cleaning, carpet cleaning, junk removal, and other similar services. The cleaning sector faced a slowdown in new work scheduled, remaining mostly below previous levels, reflecting the discretionary nature of the industry. While revenue dipped at times, the later half of the year showed improvement. The movement in both charts suggests a pricing adjustment has allowed revenue to grow during the year.
New Work Scheduled YoY — Cleaning
Median Revenue YoY — Cleaning
“In 2024, uncertainty around interest rates made customers more price-conscious, leading to fewer bookings. To address this, we increased our team’s hourly wage by 8%, ensuring we continue to attract and retain top talent. We’re also planning a price adjustment in February 2025 to align with rising costs. When you consistently deliver exceptional service and build strong relationships with your clients, they recognize the value and are willing to invest in quality”

Contracting
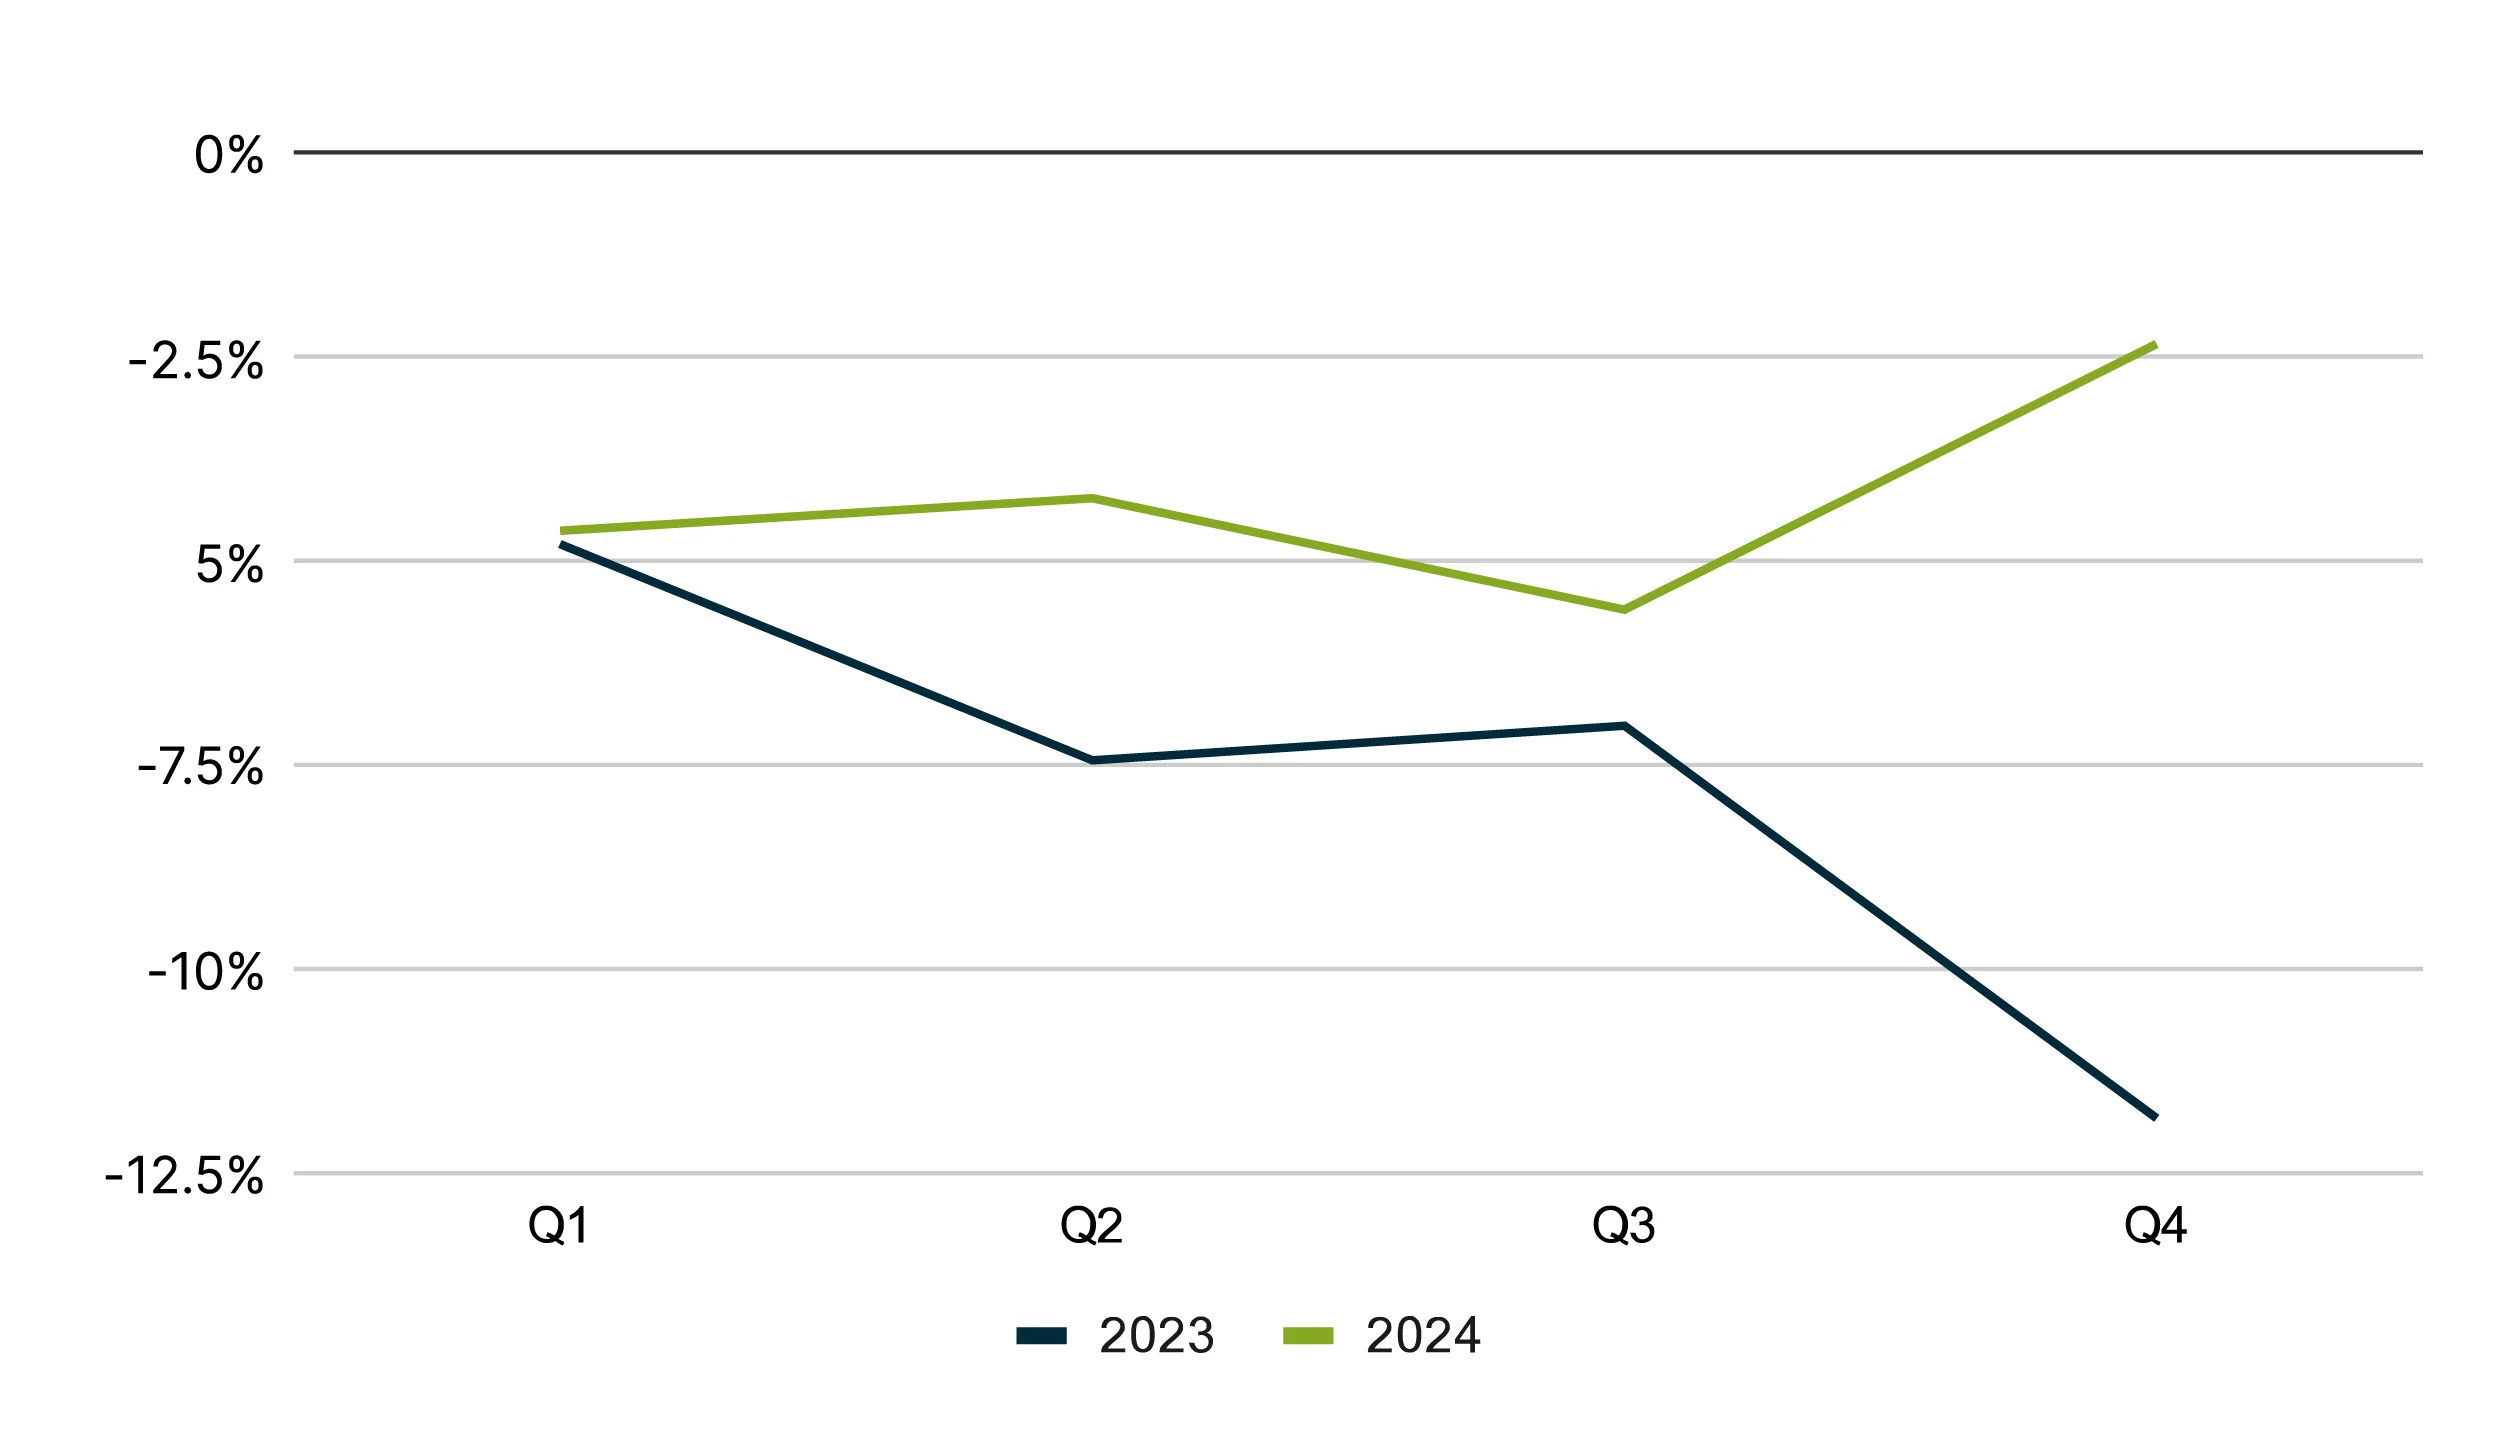
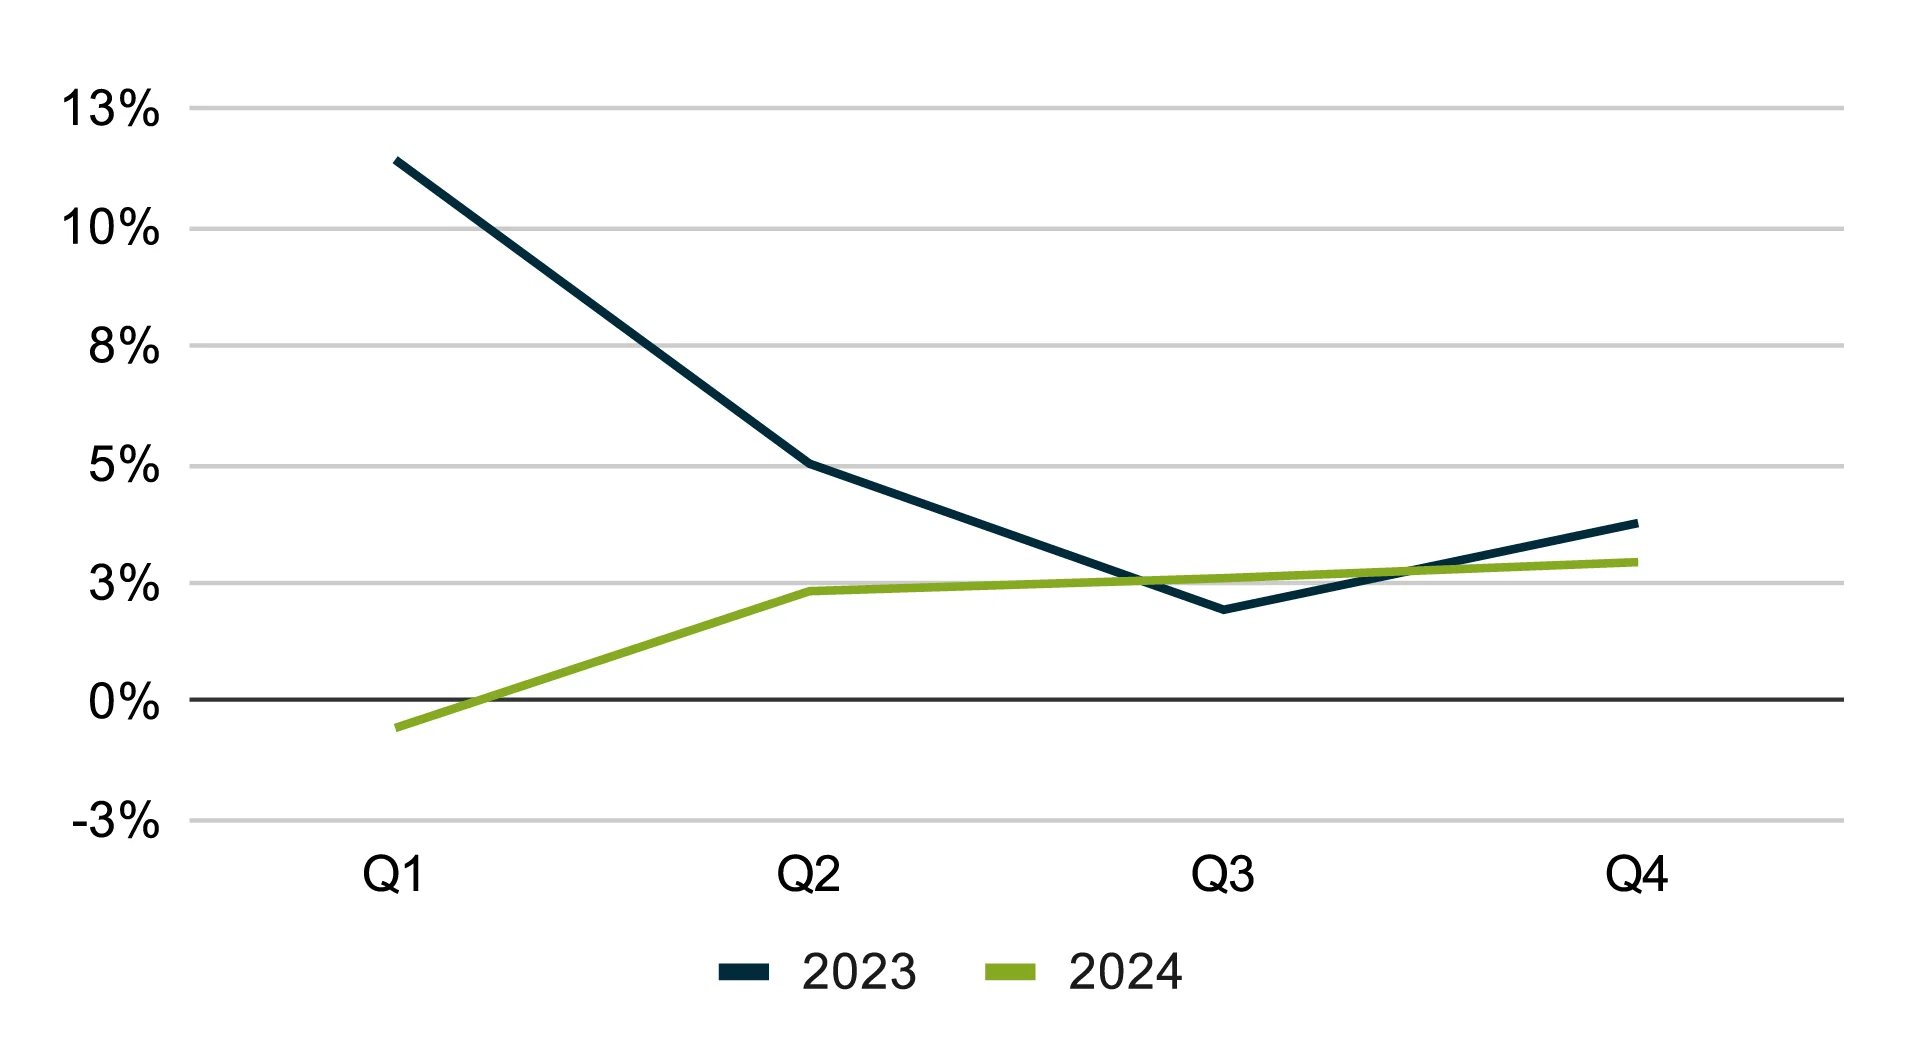
The Contracting segment, which includes arborists, electricians, handymen, HVAC technicians, plumbers, and other non-construction trades, faced challenges with new work being scheduled. However, contractors recovered towards the end of 2024, helping offset earlier declines. The strong finish in scheduled work and revenue suggests growing demand, potentially setting the stage for a stronger 2025.
New Work Scheduled YoY — Contracting
Median Revenue YoY — Contracting
“After years of inflation, we had to make the largest pricing adjustments in our 20 years of business, with the past three years seeing more increases than the previous decade combined. The biggest challenge in 2024 was navigating a tough economy—rising costs, supply chain issues, and high interest rates made growth difficult. In 2025, hiring skilled workers will continue to be challenging, but we expect double-digit growth thanks mainly to strong regional demand and an improving business climate”

Construction
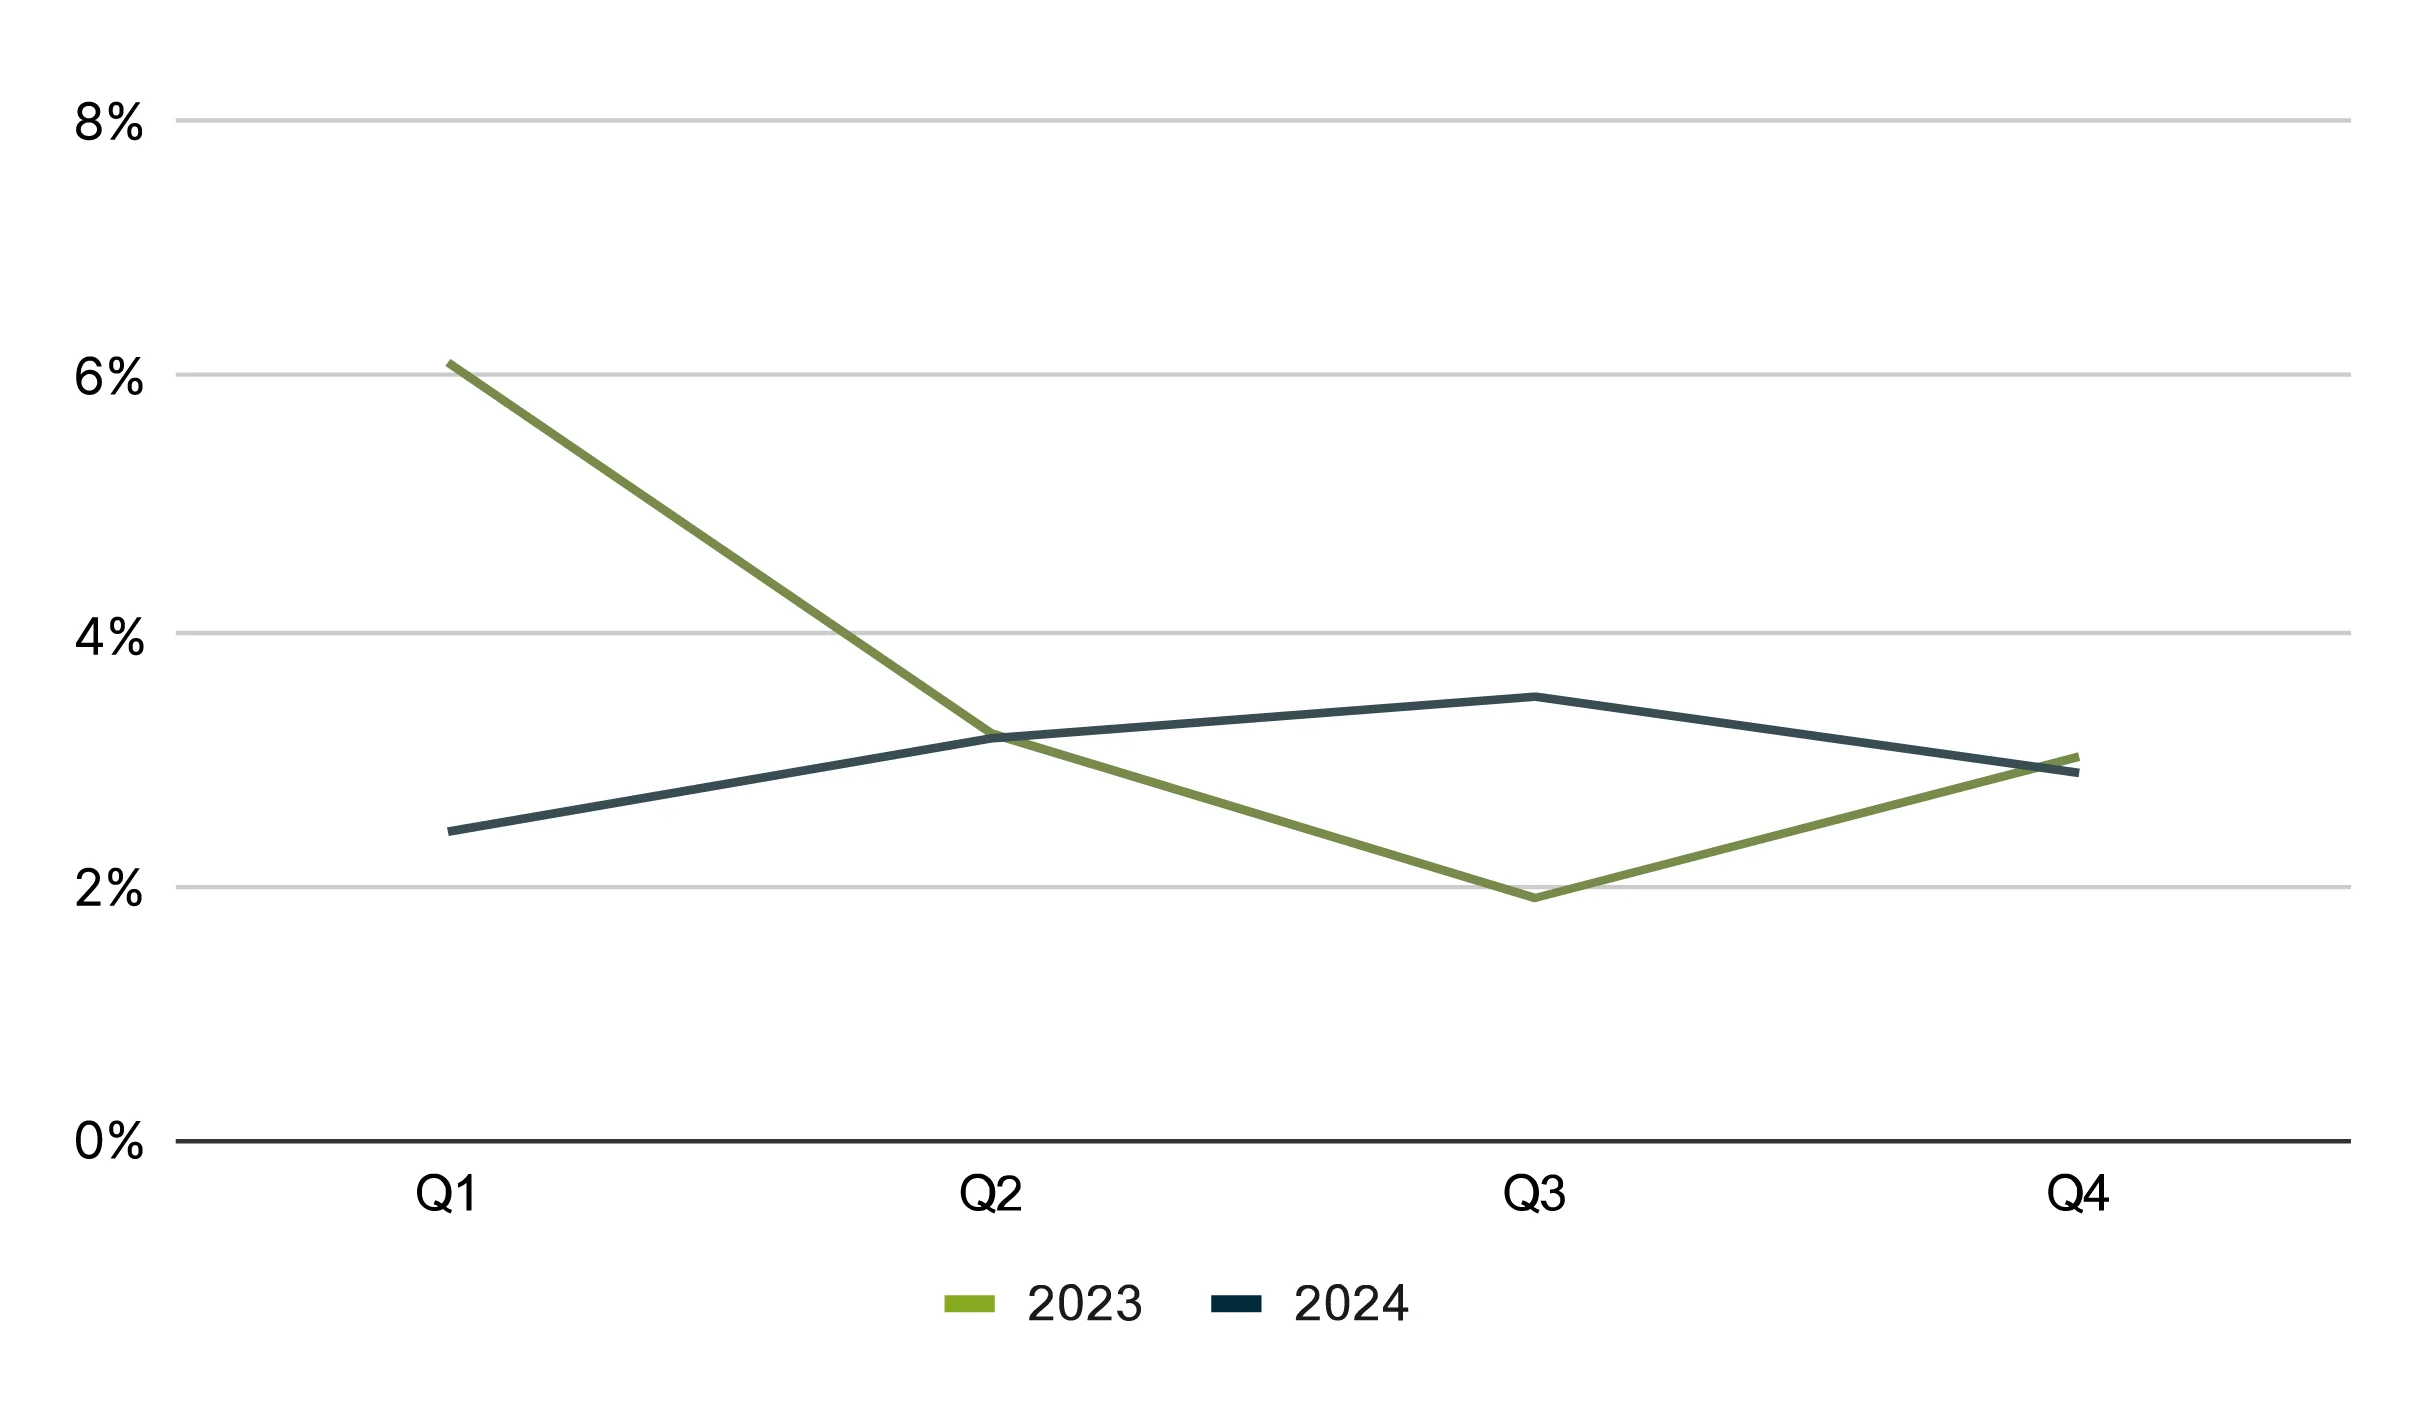
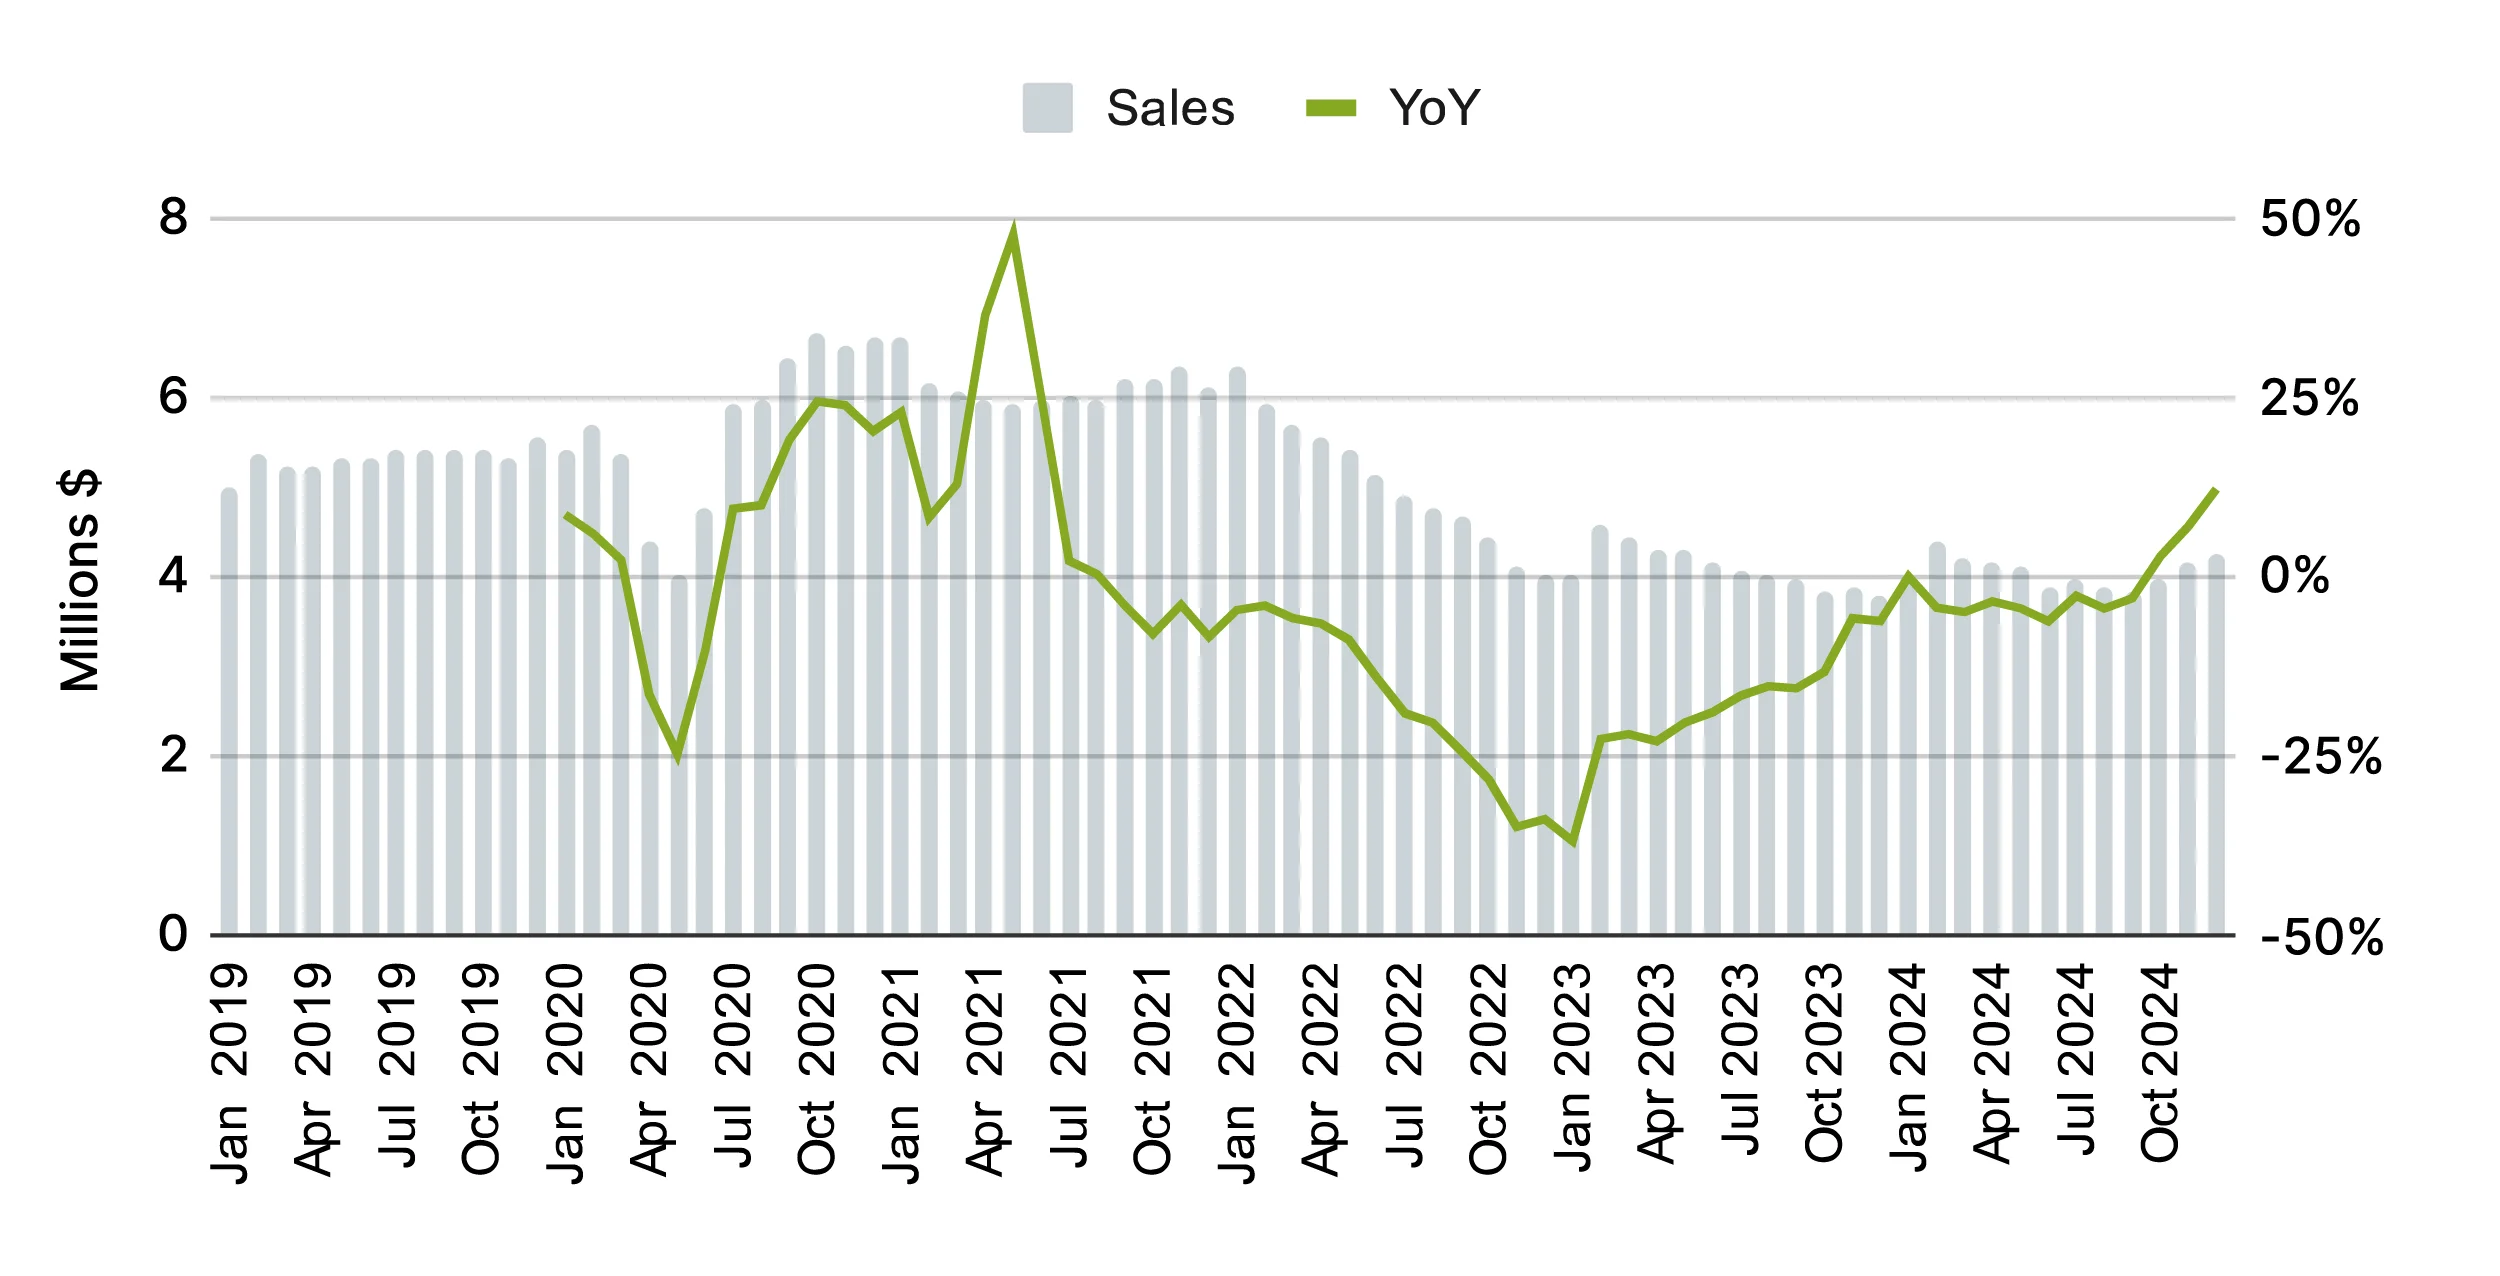
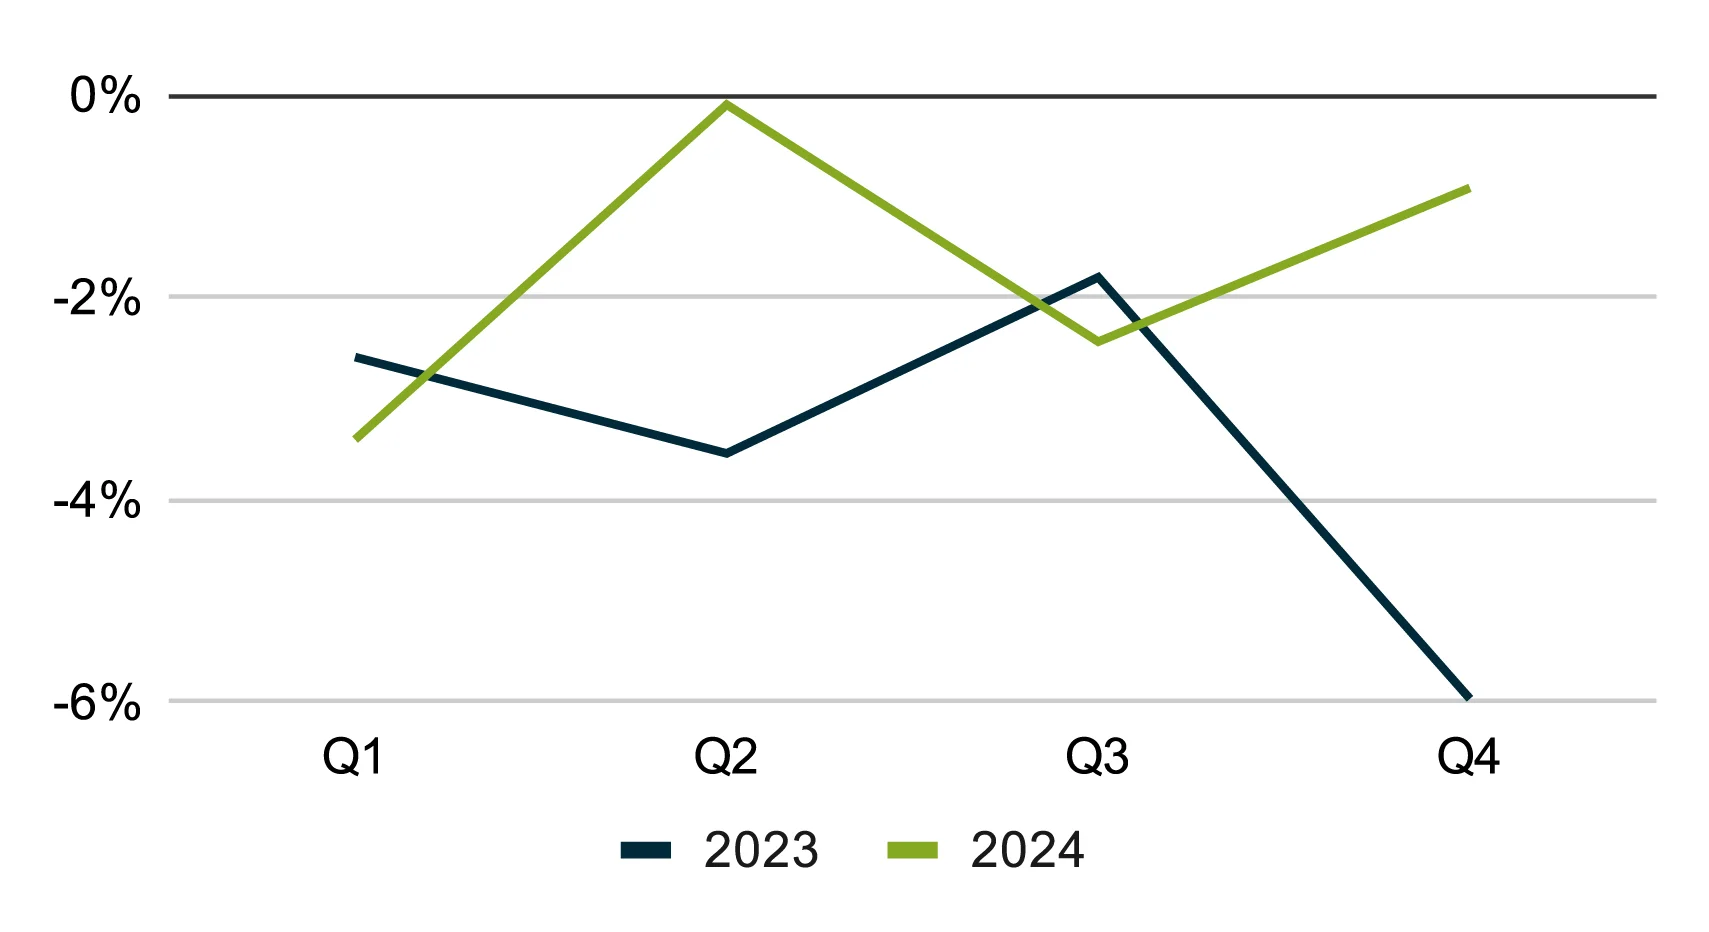
The Construction segment includes residential and commercial building and remodeling. While the year started slowly, it saw brief surges in activity around April and July before stabilizing towards the end of the year. Similarly, median revenue in the Construction sector exhibited bigger peaks and troughs throughout the year. Despite the highs and lows, the sector should improve as we see a recovery in the housing market.
New Work Scheduled YoY — Construction
Median Revenue YoY — Construction
“This year brought unique challenges due to the slowdown in housing inventory turnover, which impacted demand for our services. We’re making strategic adjustments to our recurring revenue model to stay on track with our goal of scaling to $3M in revenue. By lowering one of our tiered pricing options, we aim to increase the frequency of monthly visits. As a business owner, it’s crucial to remain adaptable and closely monitor market trends to make informed decisions that drive growth.”

Overall, 2024 was marked by increased volatility across all Home Service segments, with stronger recovery trends in the fourth quarter. The sharper revenue fluctuations indicate that external factors, such as economic conditions, played a more significant role in shaping business performance than the steadier trends observed in 2023. While the year presented challenges, the late-year improvements suggest positive momentum heading into the future.
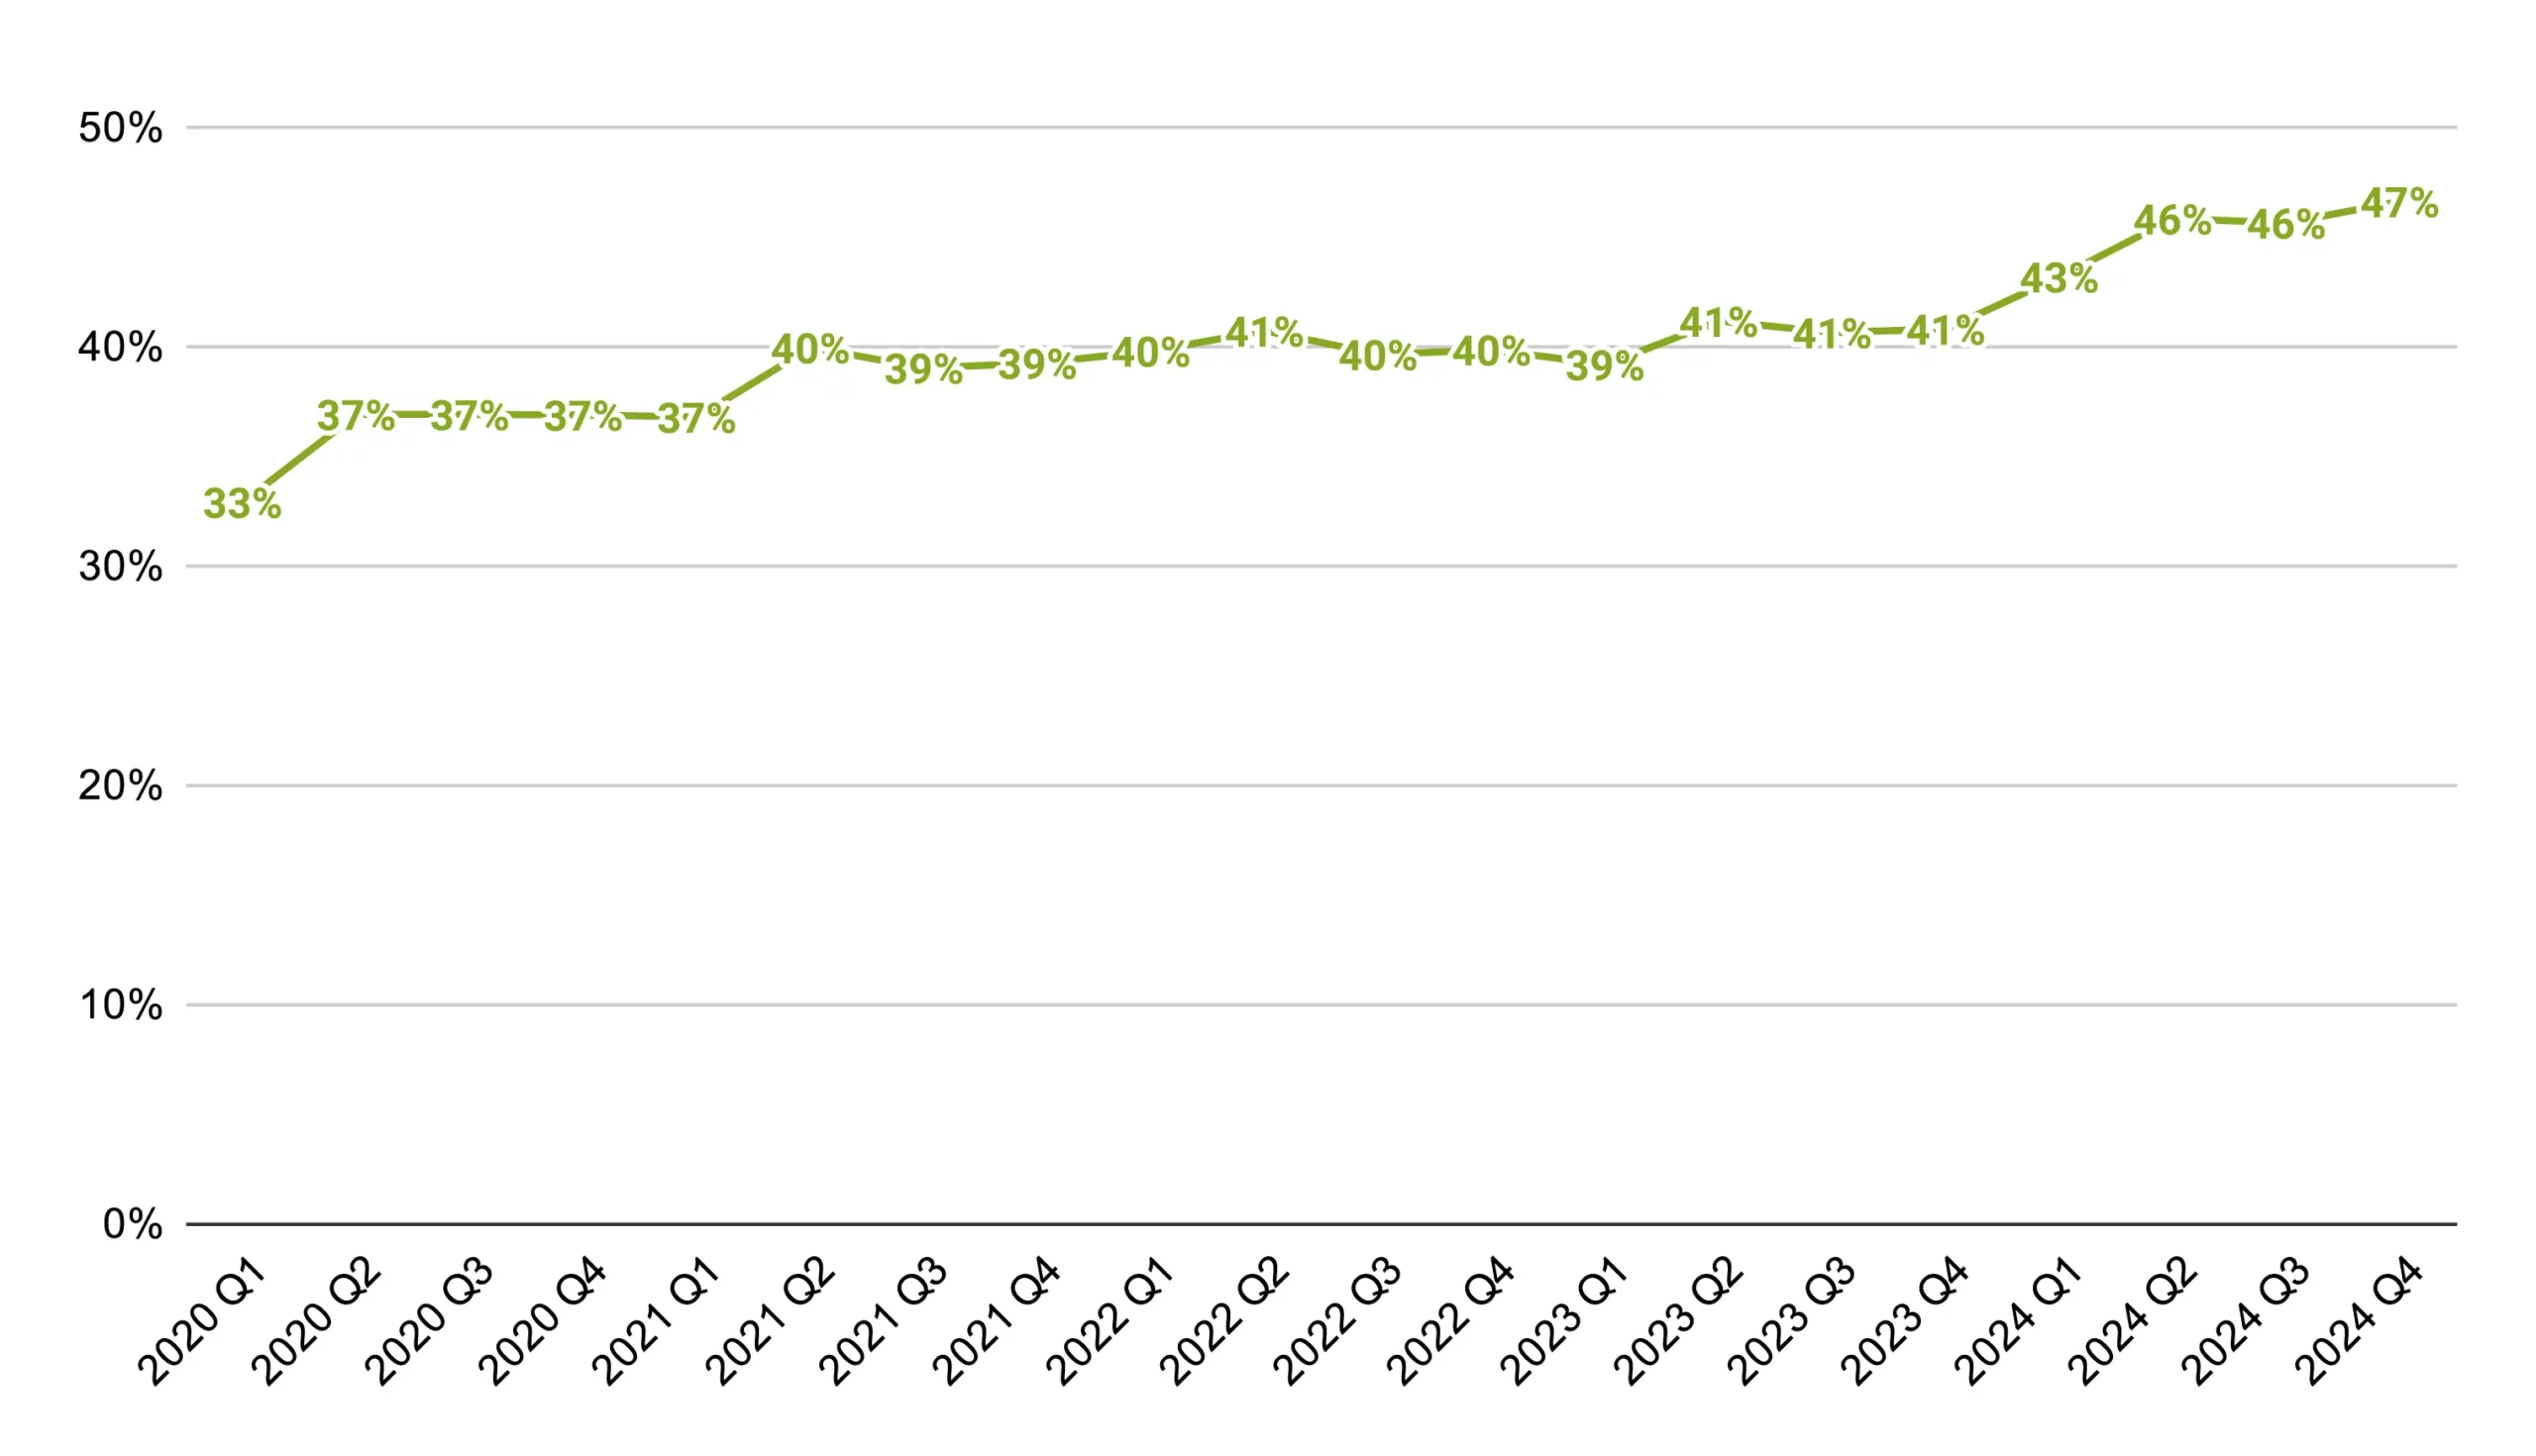
Digital Payments Adoption Reaches All-Time High
2024 experienced the most digital payments ever, as nearly half of all transactions on a dollar basis were made digitally. Consumers prefer paying more of their invoices using different payment methods rather than cash and checks. While credit cards are the most popular digital payment format, customers also choose methods like direct bank payments or ACH, Venmo, Cash App, Paypal, and Zelle. It will be important for service providers to offer multiple payment methods for consumers as we expect this trend to continue, potentially crossing 50% in 2025.
Digital Payments as % of Total Payments Collected (Quarter-over-Quarter)

Future Outlook
The Home Service category shows promising signs of recovery going into 2025 with growing consumer demand, stable inflation, and a strong job market. That said, there is uncertainty due to strained global trade relationships and potential recession concerns, which could pressure consumer spending and business costs.
Demand for home services remains resilient, but businesses should stay vigilant—focusing on pricing strategies, workforce retention, and operational efficiency to navigate shifting market conditions. Adaptability will be critical for business owners to respond to shifting economic trends throughout the year.
Methodology & Data Sources
- The small business data provided is sourced from the FAQ section of the U.S. Small Business Administration Office of Advocacy.
- The Real Disposable Personal Income data and chart is sourced from the Federal Reserve Bank of St. Louis.
- The Index of Consumer Sentiment was sourced from Surveys of Consumers by the University of Michigan.
- The Household Debt data and chart is sourced from the Federal Reserve Bank of New York.
- The Leading Indicator of Remodeling Activity data and chart are sourced from The Joint Center for Housing Studies of Harvard.
- The Home Equity Values data and chart were sourced from the Federal Reserve Bank of St. Louis.
- The Home Price Index data and chart were sourced from Fannie Mae Home Price Index.
- The monthly construction data and chart were sourced from the United States Census Bureau: Construction Spending.
- The new permits data and chart were sourced from the United States Census Bureau: New Residential Construction.
- The new housing starts data and chart were sourced from the United States Census Bureau: Monthly New Residential Construction.
- The average 30-year fixed mortgage rates were sourced from the Federal Reserve Bank of St. Louis.
- The existing home sales data and chart were sourced from Trading Economics.
- The new home sales data and chart were sourced from the United States Census Bureau: New Home Sales.
- The year-over-year change in median revenue, new work scheduled, and invoice sizes were calculated by aggregating data from a cohort of businesses using Jobber since January 2021. This doesn’t include any new businesses that started using Jobber during that period.
