 19 Minutes
How Much Did You Make Today? Track Daily Profit in Real Time
With Kasy Allen


-
Kasy (00:00):
Remodeling is really going to change on a month to month basis. For example, I start a project, I may get a lot of money up front. I’m going to get that deposit, so it’s going to look beautiful. Yet the next month I’m going to pay all my subs and it’s going to drop and I’m going to have a horrible gross profit margin. If I was to just look at my overall, then my remodel is going to make me look like I’m a roller coaster.
Adam (00:25):
At the end of each day, do you actually know how much money you made? I mean, you might know what your revenue was or how many hours your team worked, but do you actually know how much profit your team did that day? My guest today is Kasy Allen, and she’s going to help us come up with an end of day report that actually tells you how much money you made that day. And that is super critical. So Kasy, welcome to the show. Thanks for coming in.
Kasy (00:49):
Thanks for having me. I’m super excited to talk about this.
Adam (00:52):
Why is a monthly P&L just not really cutting it for you?
Kasy (00:55):
So a monthly P&L, you’re usually waiting on an accountant to come in and help you make decisions. You should educate yourself and understand what a P&L is and what gross profit margins and net profit margins are, but there’s a lot more to those numbers. You’re not pulling in advertising data or labor burden, and to be able to see all of these numbers in one place and then break it down from quarterly, monthly, weekly, daily, you can make more informed decisions instead of waiting till you eventually meet with your accountant. Or if your accountant isn’t talking to you on a monthly basis and it’s you doing your numbers, you’re usually not going to be consistent on those numbers and then you do it in a quarter and then you’re really behind. So when you’re pulling all that data into one sheet, you’re just getting data really quick and you can make better decisions.
Adam (01:38):
Your end of day report is actually a really zoomed in version in my way I look at it. The end of day report actually contributes to the P&L later. And that’s how you make the P&L what you want it to be, right?
Kasy (01:50):
Yeah. I find the metrics that I want to measure, which are probably super similar to everybody that’s watching this, but I can pull in the P&L, my Jobber reports, and then I can pull in even end of day reports from my staff. And then I can marry it to my KPIs and different measurements that I want to see when I’m trying to make a decision. Because any given day, you may want a number depending on what it is you’re working on that day. If I’m working on advertising today, I want certain numbers around that. If I’m looking at my end of day revenue to make a decision, if I’m looking to buy a vehicle, if I’m looking to hire a new person, it depends what you’re looking at, right? And you need all these numbers.
Adam (02:29):
Earlier you said there’s KPIs and metrics that pretty much every business owner that’s listening, they’re all the same. We’re all tracking the same thing. What are those numbers? Just give me some of those.
Kasy (02:38):
Okay. So your revenue for the day, for the week, for the month, and the trailing. There’s a difference between looking at month over month, year over year, but also the trailing. So that’s important. Trailing, which,
Adam (02:51):
Is the period before?
Kasy (02:53):
So the trailing seven days, the trailing 30 days.
Adam (02:56):
Rolling average.
Kasy (02:56):
Instead of just last month. Yeah, the rolling average. Gotcha. And then your gross profit margin, I’m looking at all the time. Net profit margin. I probably want to look at my COGS percentage, cost of goods. That’s going to show me really my labor. I want to look at my labor. For us, we have two different types of labor. We have our in-house and we have our subs. If I have a big remodel project, for example, we’re reliant more on our subs and I need to make sure that they’re in line so that we’re still making our profit. So those are really important numbers to look at. Besides that, going below just the P&L, we are looking at customer acquisition costs, CAC, right?
Adam (03:37):
Yeah.
Kasy (03:38):
And we are looking at attrition rate. We do cleans, that’s recurring cleans. I want to know how many clients I have and how many clients I’m losing. Because if I’m losing clients, now I want to be able to get those clients back. We’re going back to the CAC, the CAC, right? How much am I spending? Can I spend more to try to get my attrition rate back to where I want it to be?
Adam (04:00):
Gross profit is all your revenue minus your labor and your cogs, which is your materials. So if you do a job for a thousand dollars and your labor was 500 and your materials were 200, that’s $700, your gross profit was only 30%. That’s what we’re talking about, right?
Kasy (04:15):
Right. Right.
Adam (04:16):
Yep. And the net profit is gross profit minus all your overhead expenses, like your gas and your lease and your salaries for admin, your job or subscription, all those things are overhead expenses. So your net profit is gross profit minus those. Are we tracking those on the same?
Kasy (04:31):
Yep, absolutely. I totally agree. And a lot of people just say profit margin and they don’t say gross profit, net profit. I feel like a lot of times when people say profit margin, they’re talking about gross, but there is a difference between the two and those two different numbers are good to know what the standard is because the standard is different for every industry and every line of service.
Adam (04:50):
Yeah. Just for fun, give me a couple percentages that you’re aiming for, for a few of your different services.
Kasy (04:57):
So my overall gross profit would be about 50%. That would be beautiful, right? Okay. That would be great. If I dip a little bit, that’s fine. If I go up, then yay, I’m super happy. If I get down to 30, then I’m starting to dig in. What is going on? And what we do, because we have so many lines of service, my remodeling is really going to change on a month to month basis. For example, I start a project, I may get a lot of money up front. I’m going to get that deposit, so it’s going to look beautiful. Yet the next month I’m going to pay all my subs and it’s going to drop and I’m going to have a horrible gross profit margin. And if I was to just look at my overall, then my remodel is going to make me look like I’m a roller coaster or my cleaning stays smooth because it’s usually recurring, so it’s going to stay very flat. So I think you have to know that it moves like that and break it up. So if you have multiple lines of service, you have to break it up. But that’s not to say that cleaning, for example, it’s similar because you have recurring cleans that are going to keep everything consistent, but then you have deep cleans, one time cleans, those are going to bring things up and down just like the remodels do. Looking at your P&L, your gross profit on a smaller basis helps you understand those moves that happen. So that way when you’re looking at it for the month, then if you see it drops to that 30, 20% and you get that panic, then break it up and then see where that’s coming from.
Adam (06:26):
I track leads, jobs booked, number of jobs booked, estimates sent out daily. And so if I see that we’re not tracking for our weekly goal for that, the fact that I can respond in the moment is really important. So if I say, well, we could send out an email blast, we could call some old estimates, we could do something to drive that number up if we see it going down. But if you’re not tracking that kind of stuff, then you won’t do that. And then you’ll look back three weeks later and like, oh man, we started going down three weeks ago. I just now realized it. But the more that you track it and the more frequently track it, the more control you have over the outcome instead of just letting it just kind of go and hope for the best.
Kasy (07:06):
Right. And then you have even just looking at your schedule outside of a P&L and you see these holes and these gaps and you see the patterns that you’re tracking patterns. You know that maybe we need to send out a special on social media or email to help fill that schedule or maybe you’re over capacity and you’re burning out your staff and you need to hire. So in our industry, we’re constantly looking at scheduling and our employees. And you hire too many people, that means you need to get more sales. Now you have too many sales, now you have to hire people. And it’s that ladder that we’re constantly changing.
Adam (07:40):
Yeah. The fancy word for that is capacity planning. It is a dance, isn’t it? It’s a dance. We’re talking so much about data and reporting and insights. Jobber has a lot of that stuff already baked into the platform. Do you ever use that?
Kasy (07:52):
Jobber Insights makes it really, really simple to go and get a lot of those answers. The insights report pulls a lot of that data for you and you can adjust it based on the dates that you want to see. The other thing that’s really helpful is the AI feature in Jobber, and you could ask it questions and it’s all right there and it’s super simple to use and you can get really quick data insights.
Adam (08:10):
If you’re not using Jobber to track your business metrics, whether it’s lead flow or quote flow or booking rate or average job size or invoices or accounts receivable, how much money have you made? Jobber does all that. Go to jobber.com/podcastdeal, get the exclusive discount and start your trial. Start using Jobber today.
(08:30)
Let’s get nitty-gritty. The end of day report for you, how did you make it? Where is it? Is it in Jobber? Is it on a Google Sheet? Where the heck is it? Where does it live?
Kasy (08:41):
So today Jobber has the Jobber Insights and you can go and you can see the dashboard and it’s great because it gives you that instant feedback that you’re looking for. And what that report is pulling from are you have insights and then under insights is reports. And you can click into the reports and you have everything that’s coming in. So you have your quotes, you have your jobs and you have your invoices. All three of those I pull in with Zapier or some people call it Zapier and then I pull it into Google Sheets. Google Sheets is great because I use Claude to help build this entire tool. So if I get a formula wrong, it can look at it, see the formula and correct it for me. So after I pull in my Jobber reports and I’m pulling these in, it’s not me exporting, copying and pasting. And that’s the beauty of it because that’s your automation. And then in Zapier, I set it up to funnel into the Google Sheet. Then there’s a extension and this is really easy. An extension is like an add-on or a plugin and it’s in Google Sheets. It’s called Coefficient and it connects my QuickBooks to the sheet. So then I’m bypassing Zapier. And then in Coefficient, I can tell it what report to pull in and I’m pulling in the P&L.
Adam (09:55):
Interesting.
Kasy (09:55):
And it creates the tab. And you can say, I want you to pull in a monthly look. And even with the monthly numbers, you can break it down into the weekly and the daily.
Adam (10:03):
So at the end of the day, what do you know, revenue and profit and all that?
Kasy (10:08):
So you set things against goals, like how much revenue do I want to make today? And so you can see where you’re ending your day and where your revenue was. Again, it’s going to be based on the invoices that are closed, but you could also see how many jobs you did for the day and then back it up. So like I said, you can look at your week and your month, but it’s showing whatever goals you want to track for that end of the day. But it’s mainly looking at revenues, looking at the number of jobs. Because it pulls in quotes, you can look at sales data, so the number of requests that are coming in that convert into your quotes.
Adam (10:45):
Make sure to grab Jobber’s reporting playbook to help you put all of Kasy’s tips into action. Either scan the QR code on the screen or click the download link in the episode show notes to get your copy today.
(10:57)
So how did you build the goal into, did you tell Claude what you wanted to do over the course of the year? How often do you have to put the goal in or is that just baked into the cake from day one?
Kasy (11:07):
We do it annually. So in January we’re going to have our end of year review and we’ll get our numbers. Well, I’m going to chat with Claude and go from there. But before when I was doing it manually, I would look at my data over the past three years, for example, and I can see that I’m increasing by a certain percent in each of those goals. And then I would increase it based on the pattern that I had seen in the past three years. Usually I’m looking to grow and it’s like how aggressive you can grow so you increase the percentages. When I initially built this report, it was actually after we did our Q1 meeting. So I had my transcript from our end of year report. I had my transcript from my quarterly meeting. I put that transcript into Claude and said, Based on all of this, help me build a daily report that also shows me the monthly and the quarterly.
Adam (12:00):
You said transcript. Did you mean that you recorded your team’s end of the year meeting?
Kasy (12:05):
Yes.
Adam (12:05):
That was a couple hours long.
Kasy (12:06):
Yes.
Adam (12:07):
Gotcha. So you uploaded that whole transcript of that meeting into Claude?
Kasy (12:11):
Yep.
Adam (12:11):
Got it.
Kasy (12:12):
Yep. So it’s hearing now or listening, reading what it is we’re working on, what we worked on last quarter, what worked, what didn’t work, what are we working on next quarter? And now it’s building our KPIs and our goals based off of what was discussed in that meeting.
Adam (12:29):
Do you have seasonality to your business? Do you have some quarters that are really big and some quarters that are really low?
Kasy (12:32):
Absolutely. I live in a ski resort town. So during the ski season we’re high and during the summers, we’re surrounded by mountains and everybody comes for the mountains in the summer. And the mountains were high. We have what we call mud season in between.
Adam (12:47):
Gotcha. So then how do you, I’m curious if you accommodate for that seasonality in your reporting. So does Claude say that you should have done $400,000 in this quarter even though you almost closed down that quarter? Does it know that the middle two quarters of the year are your big quarters? I’m thinking about the goal, the goal throughout the year, does it accompany for those ups and downs or is it static?
Kasy (13:12):
Claude may know that I live in a mountain resort, but it may not know that seasonality. So I would be telling it that as it’s learning. Can it see the data from the report? Yes, because it can connect and it can see those. It can see that remodeling is going to be a heck of a lot more seasonal because from the end of summer to the beginning of next summer, my remodeling’s going to probably be down where my cleaning is going to stay consistent. So these are the things that you have to train and as it learns it, then it’s going to give you better data back.
Adam (13:44):
Do you have any things that you still want to build with Claude and with this project? It’s always ongoing. What’s the next thing you want to develop?
Kasy (13:52):
Absolutely. So the next step, when you know your data is really, really accurate, let’s say after a month, two months of monitoring, how do you monitor? You take your normal reporting and then this new report and compare it. When I was doing it, I was testing with Claude and Claude actually helped me go through and test it and make sure everything was accurate. But I would connect it to, my next step is to connect it to Google Looker Studio.
Adam (14:17):
Oh yeah, I’ve heard of that.
Kasy (14:17):
And it pulls the data in and it’ll create that sheet automatically for me. So literally it’s just sending a link and you can look at it at any time. And that is your dashboard that you can adjust to monthly, weekly, daily as well.
Adam (14:30):
Does your team have any interaction with this stuff? Are they able to see any of the data? Is that on the horizon for you? I’m curious.
Kasy (14:39):
It’s on the horizon. So what ultimately I’m eventually going to have a measure out on KPIs for them and then have it bonus out. So for example, for my cleaners, what I want to measure is that they’re doing the report on a daily basis. So it’s like a reliability, a scheduling. Did you come and fill out your report and send it in? And in the questions that I’m asking them, one is on safety. Was there a safety concern today? One is on customer satisfaction. Was there any issues with customers today? On a scale of one to five, how satisfied are customers? And then I can tie that back to KPIs and eventually tie it back to a bonus. I’m not talking about a huge bonus, but even an extra hundred dollars a month based on these reports being filled out because what happens with end day reports is fatigue, so reporting fatigue. And then they think that we’re not even looking at these reports is that they don’t matter and they stop doing them. So if I was able to get that in front of them once a week or once a month, then they can see that those reports do really matter and that they’re tying back to something better.
Adam (15:38):
Yeah, and they’re relevant and worth their time. I feel like this topic of having data is kind of like teaching someone how to fish and then they catch the fish, but then they don’t know what to do with the fish next. It’s like, well, I have the data. I have the fish. What do I do with it now? Can you relate to that?
Kasy (15:53):
Yes, yes. And I actually have a really good story on this. Jonathan Mast is an amazing AI guru, and he goes to conferences and teaches on AI and he’s really, really good at making it simple. He has a Facebook group called AI for Entrepreneurs. There’s over 500,000 people already members on this group. I’ve been following it for a while. He has classes on there to teach you more about AI. Anyways, there was a discussion last week on being that you can connect QuickBooks to Claude, and I’m pretty sure this is probably going to end up replacing my report, which is okay, because you’re going to be able to ask questions and it’s going to give you the feedback. So instead of having to know all of these swings and these ups and downs and learning these things, Claude eventually is going to be able to help you make these decisions. Does that mean that it’s going to feed in Jobber too? No, and that’s where this report comes in. If you have a report and that data’s feeding into one, then Claude can read this report and then help you make those decisions.
Adam (16:49):
Interesting. Yeah. Yeah. You don’t have to stare at a P&L. You can just ask Claude the question, the thing you’re looking for.
Kasy (16:56):
Yeah. How am I doing today?
Adam (16:58):
Yeah.
Kasy (16:58):
How do my numbers look today? What decisions would you make based on the numbers that you see?
Adam (17:02):
That’s pretty cool. Okay. I got lightning round for us, Kasy.
Kasy (17:04):
Okay.
Adam (17:05):
You ready for that?
Kasy (17:06):
I am.
Adam (17:06):
Number one, what are the most important metrics our listeners need to know about running their business?
Kasy (17:12):
The profit margins at the end of the day. You can dig in and get granule and get numbers on everything, but those profit numbers, and then the labor percentage.
Adam (17:20):
Why is a monthly P&L important?
Kasy (17:22):
It gives you insight into your business. It lets you know the revenue that’s coming in and the expenses that are going out.
Adam (17:27):
Why do we need an end of day report?
Kasy (17:30):
So that you get smarter with the numbers that are happening in your business and you can make more informed decisions.
Adam (17:37):
Kasy, why do you run a business?
Kasy (17:40):
Oh, I love it. It’s probably the funnest thing that I’ve done in a long time. I don’t mean to use the word fun, but it keeps me up at night, but it also wakes me up in the morning. It’s very, very exciting. I love the challenge of running a business and I’m super thankful that I’ve learned what I have and I’m here.
Adam (17:58):
Well, thanks for being here. Kasy, that was great.
Kasy (18:00):
Thank you.
Adam (18:01):
How do people find out about you, what you’re doing in Colorado, all that stuff?
Kasy (18:04):
Absolutely. We’re online at Wheatley Creek, wheatleycreek.com. And then in our socials, we’re also at Wheatley Creek.
Adam (18:10):
Awesome. Well, your whole community, your team, your family, they’re all better for it. You’re doing a great job. Thanks for being here.
Kasy (18:16):
Thank you.
Adam (18:17):
Keep it up. Promoting your best technician sounds like a win until it isn’t. Next week, we’ll cover how to develop leaders without losing your top performers in the process. And thank you for listening. I hope that you got something today that will help you look at your day from a different perspective. End of day reports, profit margin, all that kind of stuff really, really matters, helps you steer your business the right direction. I’m your host, Adam Sylvester. You can find me at adamsylvester.com. Your team, your clients, and your family deserve your very best, so go give it to them.
About the speakers

Adam Sylvester
CHARLOTTESVILLE GUTTER PROS AND CHARLOTTESVILLE LAWN CARE
Website: adamsylvester.com
Adam started Charlottesville Lawn Care in 2013 and Charlottesville Gutter Pros in the fall of 2020, in Charlottesville, VA. He likes to say, “I do gutters and grass! When it rains the grass grows and the gutters leak!” He got into owning his own business because he saw it as a huge opportunity to generate great income while living a life that suited him. He believes that small companies can make a serious impact on their communities and on every individual they touch, and he wanted to build a company that could make a big difference. His sweet spot talent is sales and marketing with a strong passion for building a place his team wants to work. Adam values his employees and loves leading people. While operations and efficiency is not something that comes naturally to him, he is constantly working to improve himself and his business in these areas.
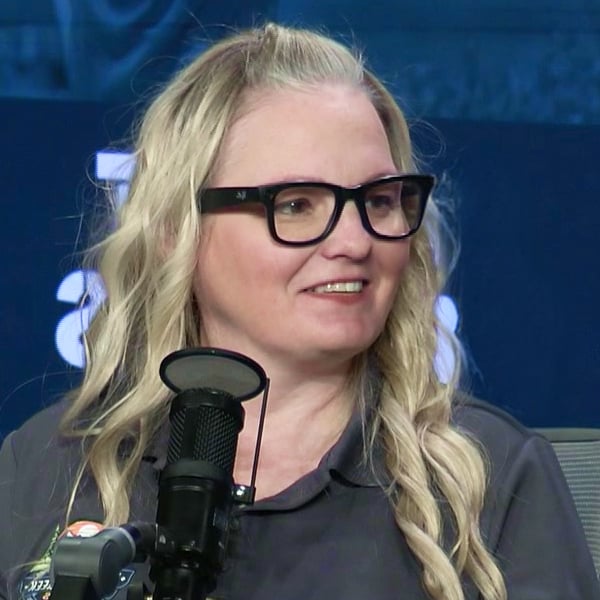
Kasy Allen
Wheatley Creek Services
Website: wheatleycreek.com
Kasy Allen is a seasoned digital marketing professional with over 20 years of experience, specializing in SEO and community-focused growth strategies. As the owner of West Agate Digital and COO of Wheatley Creek Services in Grand County, Colorado, she elevates brands by merging online marketing finesse with deep local connections. Kasy also serves as the President of the Board of Directors at Destination Granby, driving community engagement and growth. Connect with her on Facebook, Instagram, or LinkedIn.



SIGN UP FOR the masters of home service newsletter
Get monthly updates with news, tips, and advice on how to run a 5-star business. You don’t want to miss out!
Interested in being a guest on the show?
Are you a home service professional eager to share your insights and experiences? Apply to be a guest on the Masters of Home Service Podcast, and join a community of experts committed to helping others level up through knowledge.
Other Podcasts We Love